FIGURE SUMMARY
Title

Consensus guidelines for the use and interpretation of angiogenesis assays

Authors
Nowak-Sliwinska, P., Alitalo, K., Allen, E., Anisimov, A., Aplin, A.C., Auerbach, R., Augustin, H.G., Bates, D.O., van Beijnum, J.R., Bender, R.H.F., Bergers, G., Bikfalvi, A., Bischoff, J., Böck, B.C., Brooks, P.C., Bussolino, F., Cakir, B., Carmeliet, P., Castranova, D., Cimpean, A.M., Cleaver, O., Coukos, G., Davis, G.E., De Palma, M., Dimberg, A., Dings, R.P.M., Djonov, V., Dudley, A.C., Dufton, N.P., Fendt, S.M., Ferrara, N., Fruttiger, M., Fukumura, D., Ghesquière, B., Gong, Y., Griffin, R.J., Harris, A.L., Hughes, C.C.W., Hultgren, N.W., Iruela-Arispe, M.L., Irving, M., Jain, R.K., Kalluri, R., Kalucka, J., Kerbel, R.S., Kitajewski, J., Klaassen, I., Kleinmann, H.K., Koolwijk, P., Kuczynski, E., Kwak, B.R., Marien, K., Melero-Martin, J.M., Munn, L.L., Nicosia, R.F., Noel, A., Nurro, J., Olsson, A.K., Petrova, T.V., Pietras, K., Pili, R., Pollard, J.W., Post, M.J., Quax, P.H.A., Rabinovich, G.A., Raica, M., Randi, A.M., Ribatti, D., Ruegg, C., Schlingemann, R.O., Schulte-Merker, S., Smith, L.E.H., Song, J.W., Stacker, S.A., Stalin, J., Stratman, A.N., Van de Velde, M., van Hinsbergh, V.W.M., Vermeulen, P.B., Waltenberger, J., Weinstein, B.M., Xin, H., Yetkin-Arik, B., Yla-Herttuala, S., Yoder, M.C., Griffioen, A.W.
Source
Full text @ Angiogenesis

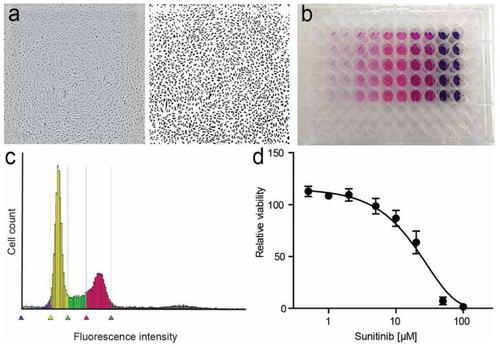
Endothelial cell proliferation assays. a Phase-contrast image (left) and binarized image of HUVEC grown in a regular 96-well plate. Simple software solutions can be used to count features in the image. b Example of MTT assay, with color intensity correlating with cell number. c DNA staining profile of HUVEC using PI, measured on a plate cytometer. d Cell viability of HUVEC exposed to sunitinib, measured using a luminescent assay

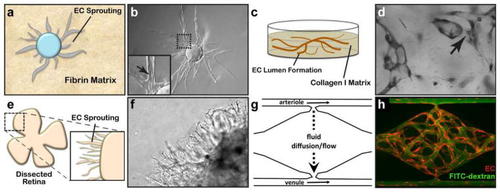
Three-dimensional assays of vascular morphogenesis. a A fibrin bead assay uses collagen I- and EC-coated Cytodex beads embedded within a 3D fibrin gel matrix to measure EC sprouting and lumen formation. b These features are readily resolved using phase-contrast microscopy. c EC tube formation can be measured by embedding EC within a collagen I matrix. d Once formed, these tubes can be visualized by toluidine blue staining and bright-field microscopy. e Whole-mount, dissected retinas from postnatal mice are mounted within collagen I-Matrigel matrix mix and cultured in pro-angiogenic medium to stimulate EC sprouting. f Sprout and lumen formation are resolved using phase-contrast microscopy. g The vascularized micro-organ (VMO) approach utilizes “arteriole” (high pressure) and “venule” (low pressure) microfluidic channels to drive medium diffusion and flow across a cell chamber where microvasculature forms. h The formed microvasculature (EC, red) can be measured for leak by perfusion with 70 kDa FITC-dextran (green)

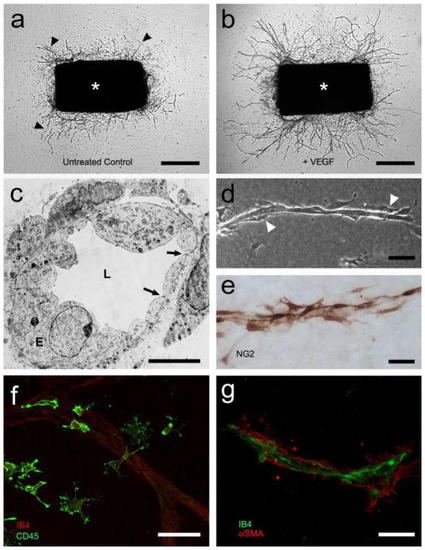
Aortic ring assay of angiogenesis. a Serum-free collagen gel culture of rat aorta (asterisk) photographed at day 6 (microvessels marked by arrowheads). b Aortic culture treated with VEGF (5 ng/ml) shows increased number of microvessels (day 6). c Electron micrograph of aorta-derived microvessel with polarized endothelium (E), patent lumen (L), and surrounding pericytes (P); endothelial tight junctions are marked by arrows. d Phase-contrast micrograph of microvessel composed of an inner core of endothelial cells and surrounding pericytes (white arrowheads). e Pericytes highlighted with immunoperoxidase stain for NG2. f Immunofluorescent image of aorta-derived macrophages stained for CD45; an isolectin B4 (IB4)-stained endothelial sprout is visible in the background. g Confocal image of microvessel double stained for endothelial cells (IB4) and pericytes (alpha smooth muscle actin, αSMA). Magnification bars = 500 μm (a, b), 5 μm (c), 50 μm (dg)

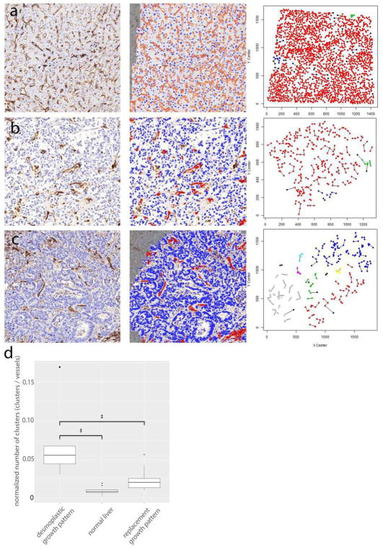
Microvessel density and histopathological growth patterns. a Unsupervised spatial modeling of the blood vessel pattern in normal liver shows a low number of clusters per number of vessel profiles. A selected region of interest (ROI) at the tumor–liver interface of normal liver in CD31-stained tissue is shown (left). The Blood Vessel Analysis algorithm of Definiens™ segments and classifies blood vessel objects (orange) and nuclei (blue) (mid). The Cartesian coordinates (x, y) of the centroids of all vessel objects in one ROI were used in a simplified “SeedLink” clustering method [646] (right). Centroids with the same color (e.g., red) belong to the same cluster. b Unsupervised spatial modeling of the blood vessel pattern in a colorectal cancer liver metastasis with a replacement growth pattern shows a low number of clusters per number of vessel profiles. A selected region of interest (ROI) at the tumor–liver interface of replacement growth pattern in CD31-stained tissue is shown (left). The Blood Vessel Analysis algorithm of Definiens™ segments and classifies blood vessel objects (red) and nuclei (blue) (mid). The Cartesian coordinates (x, y) of the centroids of all vessel objects in one ROI were used in a simplified “SeedLink” clustering method [646] (right). Centroids with the same color (e.g. red) belong to the same cluster. c Unsupervised spatial modeling of the blood vessel pattern in a colorectal cancer liver metastasis with a desmoplastic growth pattern shows a high number of clusters per number of vessel profiles. A selected region of interest (ROI) at the tumor–liver interface of desmoplastic growth pattern in CD31-stained tissue is shown (left). The Blood Vessel Analysis algorithm of Definiens™ segments and classifies blood vessel objects (red) and nuclei (blue) (mid). The Cartesian coordinates (x, y) of the centroids of all vessel objects in one ROI were used in a simplified “SeedLink” clustering method [646] (right). Centroids with the same color (e.g., red) belong to the same cluster. d Tukey boxplots of the normalized number of clusters of blood vessel objects for the desmoplastic growth pattern, the replacement growth pattern, and normal liver. There was a statistically significant difference between the growth patterns as determined by one-way ANOVA [F(2,22) = 10.8, p < 0.001]. A post hoc Tukey test showed that the number of clusters divided by number of vessel objects was significantly different between the desmoplastic growth pattern and the replacement growth pattern (p < 0.05, ‡), but also between the desmoplastic growth pattern and normal liver (p < 0.001,‡). However, no difference was found between the replacement growth pattern and normal liver (p > 0.05). Outliers are plotted as points (·) and extreme values are plotted as asterisks (*)

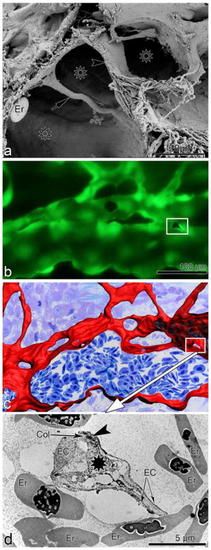
Intussusceptive angiogenesis—the methodological challenge. a Scanning electron microscopy image of transluminar pillars. Early stage is characterized by tinny pillar (arrow), formed mainly by endothelial protrusions coming from the opposing EC. At later stages, the pillar (arrowhead) is increasing in girth and its core is invaded by perivascular cells, fibroblasts, and fibers (visible in the lower disrupted part of the pillar). Lumen of the vessel is marked with asterisks. Adapted from [647]. b Dynamic in vivo observation of the regenerating zebrafish fin vasculature demonstrated a newly formed pillar (rectangle). c Three-dimensional reconstruction based on serial semi-thin sections from the same area depicted in b, d transmission electron micrograph demonstrates the transluminal tissue pillars (rectangle in b, c) at ultrastructural level. Black asterisk indicates the core of the pillar, while arrowhead pointed to cell–cell contacts between the endothelial cells (EC). Er erythrocyte, Col collagen fibers. Adapted from [648]

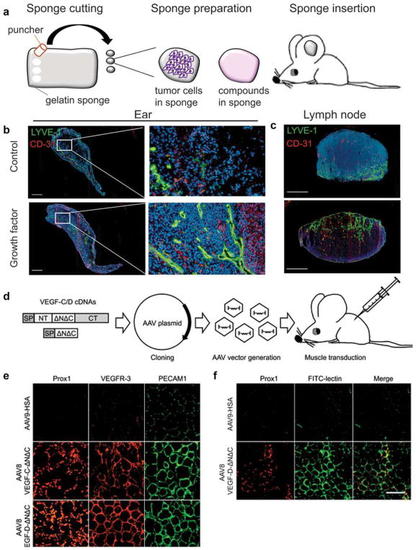
Stimulation of lymphatic and blood vessel growth in vivo. ac Preparation of gelatin sponges for lymphangiogenic assay. a Small pieces of gelatin sponge are detailed with a puncher before to be soaked with tumor cells or a compound. Prepared sponges are inserted in mouse ear between the two skin layers. b, c Immunohistochemical analysis of sponges (b) and sentinel lymph node (c) resected from mouse with control sponge (PBS or medium without growth factor) or from mouse with sponge imbedded with growth factor. Lyve-1 (lymphatic endothelial cell marker) is stained in green, and CD-31 (blood endothelial cell marker) is stained in red. Sponges soaked with growth factor showed higher lymphangiogenesis and angiogenesis compared to control sponge. Scale bar in b, c—250 μm. df Preparation of AAV and transduction of skeletal muscle. d Schematic representation of different VEGF-C and VEGF-D isoforms, produced by step-by-step proteolysis, and general AAV production and usage protocol. e Immunohistochemical analysis of t.a. muscle transduced with AAV8 encoding VEGF-C-ΔNΔC or VEGF-D-ΔNΔC. Tibialis anterior muscles of C57BL/6 J male mice (8 weeks old) were injected with 109 AAV8 particles in 30 μl of PBS, and the mice were euthanized 2 weeks later. T.a. muscle samples were isolated and analyzed immunohistochemically for the indicated markers. HSA human serum albumin. f Analysis of the functionality of lymphatic vessels. Lectin (from Lycopersicon esculentum), conjugated with FITC (FITC-lectin) was injected to the distal part of t.a. muscle. After 45 min, the mice were euthanized and t.a. muscle was isolated, fixed, and stained for Prox1. Lectin is visualized by FITC. Scale bar in e, f—50 μm

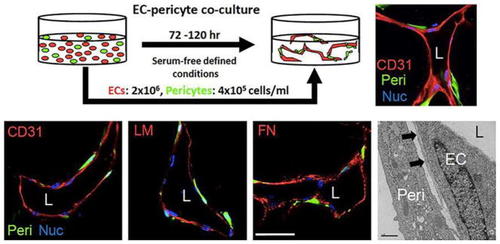
Serum-free defined model of human endothelial cell-pericyte tube co-assembly in 3D collagen matrices. a Human EC and GFP-labeled pericytes (Peri) were seeded together at the indicated cell densities and after 120 h, were fixed and stained with anti-CD31 antibodies. The immunostained cultures were imaged using confocal microscopy. The serum-free defined culture system contains SCF, IL-3, SDF-1α, FGF-2 and insulin (a component of the RS II supplement), which are required to be added in combination. b Cultures fixed at 120 h were immunostained with antibodies to CD31, laminin (LM), and fibronectin (FN) and were imaged using confocal microscopy or were examined by transmission electron microscopy. Arrows indicate the capillary basement membrane. L indicates lumen while Nuc indicates nuclear labeling. Bar equals 25 μm

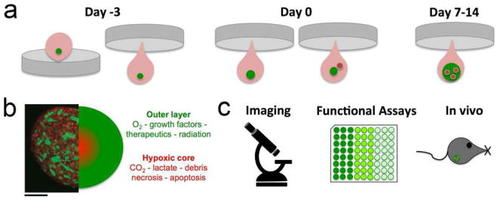
EC co-culture spheroid assay. a Overview of the procedure of the hanging drop spheroid growth assay over time. Prior to initiating the co-culture, tumor cells (green) are allowed to establish initial micro-spheroids by themselves. Typically, after 72 h EC can be introduced (red) and their incorporation monitored over time up to 14 days. b After 7 days, the tumor-EC spheroid can be quantitatively and qualitatively evaluated by various techniques, such as c (fluorescence) microscopy, histology, functional assays or implanted in vivo. Breast tumor cells (green; GFP-4T1) are combined with 2H11 EC (red) stained with MitoTracker Red. Scale bar = 100 μm

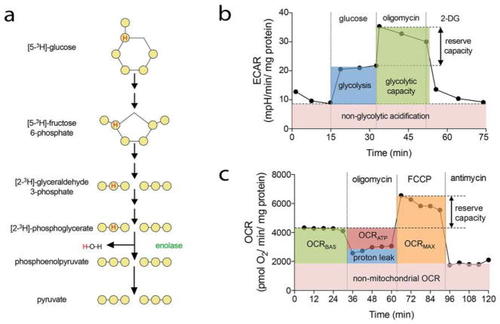
Methods to measure EC metabolism using radioactive tracers and Seahorse XF analyzer. a Schematic representation of glycolytic flux measurements with [5–3H]-glucose. A single tritium present on 5C glucose is released as water in the ninth step of glycolysis catalyzed by enolase. b Schematic representation of the modified Glycolysis Stress Test. The first measurements of ECAR are performed while ECs are incubated in glycolysis stress test medium (without glucose and pyruvate). The injection of glucose leads to the saturation of glucose concentration and allows measuring glycolytic rate (blue). Second, injection of oligomycin blocks oxidative ATP production and shifts the energy production to glycolysis, with the subsequent increase in ECAR revealing the cellular maximum glycolytic capacity (green). The difference between glycolytic capacity and glycolysis rate defines glycolytic reserve. The final injection of 2-deoxyl-glucose (2-DG) inhibits glycolysis, and the resulting decrease in ECAR confirms that the ECAR produced in the experiment is due to glycolysis. ECAR, prior to glucose injection or after 2-DG injection, is referred to as non-glycolytic acidification (pink). c Schematic representation of the modified Seahorse Cell Mito Stress Test. First injection of oligomycin blocks ATP synthase and allows the calculation of the ATP coupled oxygen consumption rate (OCRATP; red). Second, injection of FCCP maximizes the OCR by uncoupling the OXPHOS, enabling to calculate the spare respiration (reserve capacity). Third, antimycin-A treatment blocks complex III of ETC enables the calculation of the basal mitochondrial respiration (OCRBAS; green), the maximal mitochondrial OCR (OCRMAX; orange), the proton leakage (blue), and the non-mitochondrial OCR (pink)

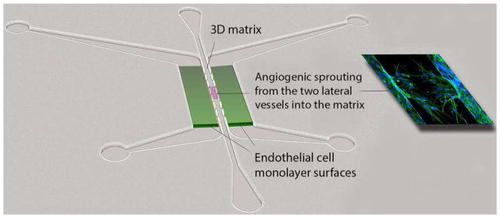
PDMS microfluidic device for analyzing angiogenesis. Fluid flow can be controlled connecting syringe pumps to the ports, or by imposing hydrostatic gradients. Flow can be directed through the endothelial lumens (green), or across the endothelial junctions, through the central matrix gel. Sprouting occurs through the apertures that flank the central 3D matrix and is easily visualized and quantified (Adapted from [221])

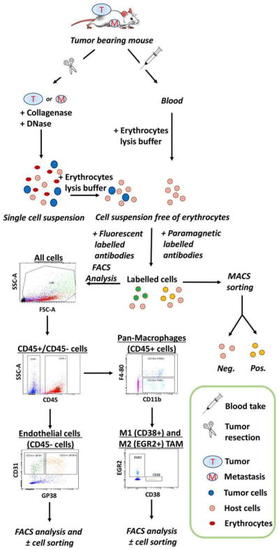
Representative flow-chart of flow cytometry and cell sorting experiments. Overview of samples collection (tumors, organs bearing metastasis, and blood) from mice and the procedure to obtain a single-cell suspension after tissue dissociation, erythrocytes lysis, and cell labeling with fluorescent or paramagnetic-coupled antibodies. Analysis of blood-circulating cells only requires a red blood cell lysis prior to incubation with antibodies of interest. Intracellular antigens can be detected by adding a cell permeabilization step. Fluorescent labeled cells are analyzed by flow cytometry and sorted by FACS while cells labeled with paramagnetic-coupled antibodies can be sorted by MACS. MACS can be used to pre-enrich cells for subsequent FACS sorting. Cell populations of interest are identified in by dot plots analysis of collected data

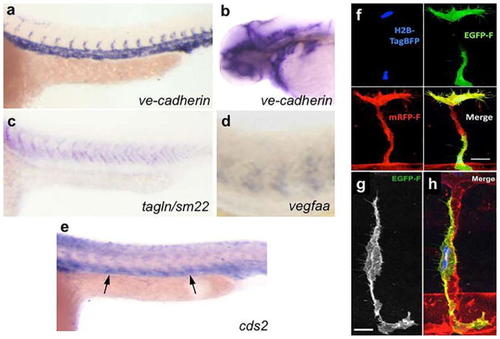
Assessing EC autonomous gene function in zebrafish. ae Whole mount in situ hybridization of 24–48 hpf zebrafish embryos. abve-cadherin labeling of the vasculature in the trunk (a) and head (b) of a zebrafish embryo showing vascular-specific labeling. cdtagln/sm22 (c) and vegfa [308] (d) showing labeling of non-vascular (somitic) tissues in the trunk. e cds2 [309] labeling of both vascular (arrows) and non-vascular tissues. f Confocal micrograph of a growing trunk intersegmental vessel in a 32 hpf Tg(kdrl:mRFP-F)y286 embryo (red vessels), mosaically expressing Tol2(fli1a:H2B-TagBFP-p2A-egfp-F) transgene (blue EC nuclei, green EC cytoplasm), showing blue, green, and red fluorescent channels and all three merged. gh Higher-magnification images of GFP fluorescence (g) and merged GFP/BFP/RFP fluorescence (h) in a 48 hpf Tg(kdrl:mRFP-F)y286 transgenic animals mosaically expressing a Tol2(fli1a:H2B-TagBFP-p2A-egfp-F) transgene in a single EC in a trunk intersegmental vessel. Scale bars = 20 μm (f), 10 μm (gh). Images in panels fh are from Ref. [649]

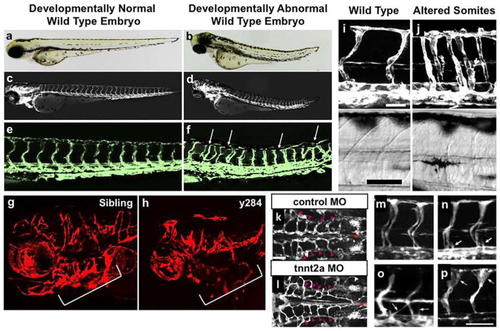
Assessing embryonic morphology and effects on vascular patterning. af Transmitted light (a, b), epifluorescence (c, d), and confocal (e, f) images of three dpf developmentally normal (a, c, e) or developmentally abnormal (b, d, f) embryos from the same Tg(fli1:egfp)y1 transgenic “wild-type” zebrafish population. The normal animal has a normal morphology (a) and normal vessel patterning (c, e), while the developmentally abnormal animal has a stunted, somewhat malformed trunk (B) and also displays trunk intersegmental vessel patterning defects (d, f). g, h Confocal images of the cranial vasculature in 48 hpf wild-type sibling (g) and y284 mutant (h) Tg(kdrl:mRFP-F)y286 animals. The y284 mutants have small heads heads and eyes, accompanied by reduced and abnormal formation of cranial vessels and aortic arches (brackets). The vascular defects should be interpreted with caution, as they can be primary or solely a consequence of the smaller head (or possibly both). Transplantation and/or mosaic transgenic expression can be used to assess the vascular cell autonomy of phenotypes. i, j Confocal (top) and corresponding transmitted light (bottom) images of 48 hpf Tg(fli1:egfp)y1 wild-type sibling (i) and fused somites (fssy66) mutant (j) animals. Improper somite formation in fssy66 mutants (lack of chevron shaped somite segments, seen in the bright-field images) indirectly results in altered intersegmental vessel patterning (j, top). kp Confocal images of the hindbrain vasculature (k, l) or trunk intersegmental vessels (mp) in Tg(fli1:egfp)y1 control (k) or cardiac troponin T type 2a (tnnt2a) (lp) deficient animals at 1.5 (m), 2 (k, l, n), 2.5 (o), or 3.5 (p) days post-fertilization (dpf). Control animals have normal blood flow, but tnnt2a-deficient animals have no heart beat and lack all blood flow. Although formation of the vasculature is largely normal for several days in the absence of blood flow (l, n, o), abnormalities in vessel growth and patterning begin to appear at later stages, such as enlargement of the dorsal intersegmental vessels at 3.5 dpf (p). This illustrates the need to analyze vascular phenotypes as early in development as possible in zebrafish with absent or defective blood flow. All images are lateral views, rostral to the left, except panels k and l, which show dorsal views, rostral to the left. Images in panels i and j are from Ref. [306], images in panels k and l are from Ref. [650], and images in panels mp are from Ref. [651]. Scale bars = 50 μm

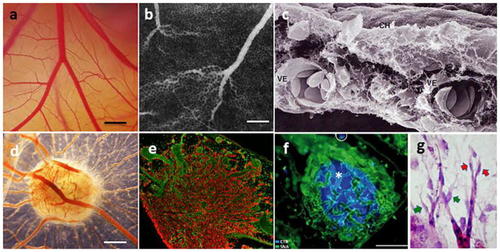
Chorioallantoic membrane of the chicken embryo (CAM). a Bright-field image of the CAM vasculature presenting the functional vascular network from capillaries to big vessels imaged at embryo development day 10 (E10). Bar corresponds to 500 μm; b Vascular network of the CAM presented on the fluorescent angiography with FITC-dextran and an intravenous contrast agent. Bar corresponds to 500 μm; c Scanning electron microscopic picture showing the chorionic epithelium (CH) and two large vessels (VE) in the intermediate mesenchyme of a CAM at day 5 of incubation (reproduced from [652]); d A 12-day CAM incubated on day 8 for 4 days with bioptic specimen of ACN/neuroblastoma cell line tumor xenograft, showing numerous blood vessels around the graft (reproduced from [653]). Bar corresponds to 500 μm; e Immuno-histology of a glioma (U87 tumor) implanted on the CAM with tumor cells in red (vimentin staining and vessels in green(SNA isolectin staining), magnification ×4; with permission from [362], copyright (2005) National Academy of Sciences, USA; (f) a pancreatic adenocarcinoma (BxPC3) nodule (blue, Hoechst) inside of the CAM surrounded by blood vessels (green, SNA isolectin staining). bar corresponds to 100 μm; with permission from [363], copyright, Elsevier (License number 4307171269037); g MCF7-derived tumor implanted on CAM induces angiogenic response. Tip cell (red arrow) and incompletely attached pericytes (yellow arrow)

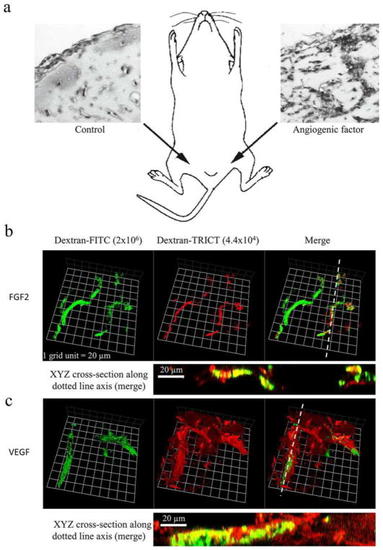
In vivo BME/Matrigel plug assay in mice. Injection of BME/Matrigel in the groin/abdomen areas of a mouse. The left image is a plug without growth factors; the right image represents a plug with an angiogenic growth factor. b, c Confocal microscopy images of whole-mount Matrigel plugs, with labeled dextran tracers. Matrigel plug angio-genesis induced by (b) FGF-2 resulted in stable vessels, with co-localization of large FITC-dextran and small TRITC-dextran within the vessels, which appear as yellow (XYZ planes). Matrigel plug angio-genesis induced by (c) VEGF resulted in highly permeable vessels, with most TRITC-dextran extravasated outside the FITC-dextran positive vessels. Images were captured using a Carl Zeiss LSM510 META or LSM 780 confocal microscope. Volocity® software (Perkin Elmer) was used to reconstruct 3D images of the vessels from serial Z-sections

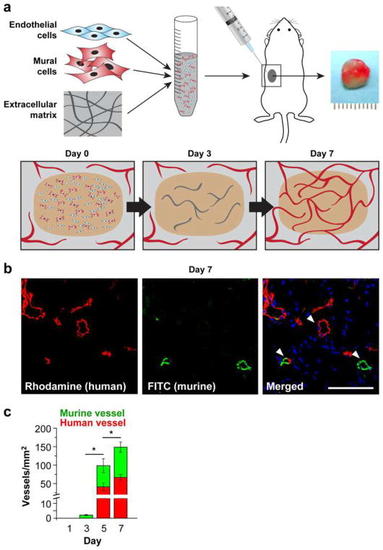
In vivo vascular network formation assay. a Schematic of the two-cell model. b Tail vein injection of rhodamine-UEA-I and FITC-GS-B4 labels perfused human (red) and murine (green) vessels on day 7 after cell/Matrigel subcutaneous injection. c) Quantification of lectin-labeled human and murine vessels shows that perfused human vessels present at day 5 and day 7

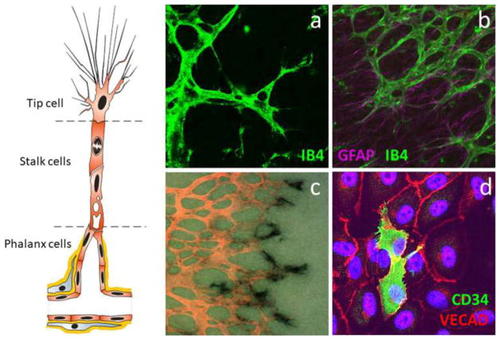
Identification of tip cells. The tip cell is the leading cell of an angiogenic sprout with long filopodia extensions, followed by stalk cells that proliferate and phalanx cells that form a matured new capillary. a Tip cells in the developing mouse retina can be identified by staining with isolectin B4 (IB4). b The mouse retinal vasculature (IB4) follows the astrocytic meshwork (GFAP) when forming the superficial vascular plexus during development. c A combination of collagen type IV IHC (in pink) for general staining of blood vessels and ISH for PDGFB (black) for specific identification of tip cells in the developing mouse retina. d Tip cells in endothelial cell cultures are identified by CD34

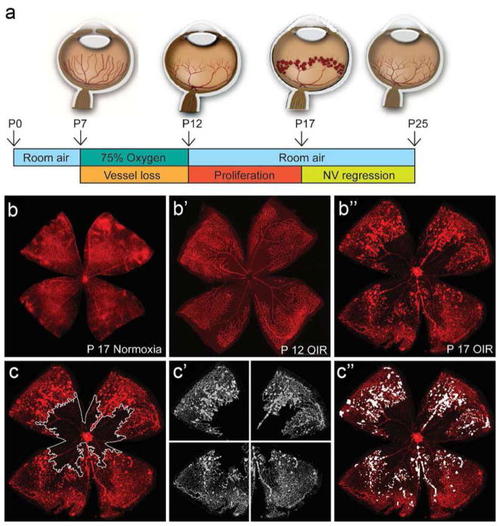
Mouse model of oxygen-induced retinopathy (OIR). a The mouse model of oxygen-induced retinopathy (OIR). Neonatal mice and their nursing mother are placed into 75% oxygen from P7 to P12, which induces loss of immature retinal vessels, leading to a central zone of vaso-obliteration (VO). After returning to room air at P12, the central avascular retina becomes hypoxic, inducing vascular regrowth with pathologic neovascularization (NV). At P17, the maximum severity of NV is reached. NV starts to regress shortly after P17 and almost no VO or NV remains visible by P25. b Retinal whole mount stained with isolectin-B4-Alexa (red) displaying a normal vascular development at P17 under normoxic condition. b′ OIR P12 retinal whole mount showing an extensive VO area without NV. b″ OIR P17 retinal whole mount showing a decreased VO with NV at its maximum. c Quantification of vaso-obliteration (VO) by manually outlining the avascular area with image-processing software (Photoshop, Adobe Systems) c′ For computer-aided NV quantification, both the original image and the VO image generated with Adobe Photo-shop were imported into NIH’s free-access ImageJ software. The SWIFT_NV macroset isolates the red color channel, subtracts background fluorescence, and divides the VO image into four quadrants. c″ SWIFT_NV then allows the user to outline NV tufts but not normal vessels by setting a fluorescence threshold for each quadrant. The macroset then quantifies all NV pixels from all four quadrants, reports the result as neovascular total area, and creates an overlay of NV and original image

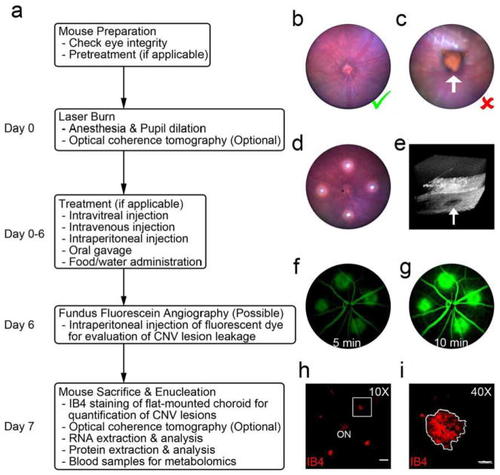
Experimental flowchart of the image-guided laser-induced CNV model and data collection. a Overview of the procedure for CNV induction involving mouse preparation and followed by experimental treatment, sample preparation, and analysis. b Representative image of normal fundus (Green check mark). c Representative image of anomalous structure (white arrow) in the eye, which is not suitable for laser photocoagulation (Red X). d Representative image of normal fundus with four laser burns shown as bright white spots. e Representative image of a successful laser burn (white arrow) with 3D optical coherence tomography. f, g Representative ocular fundus fluorescein angiography images at 5 and 10 min after the injection of fluorescent dye at day 6 after laser burn. h Representative images of flat-mounted choroid with IB4 staining at day 7 after laser photocoagulation. Scale bar: 200 μm. ON: optic nerve. (i) Higher magnification of the laser-induced CNV lesion highlighted in panel H. Scale bar: 50 μm. Reproduced with permission from [467]

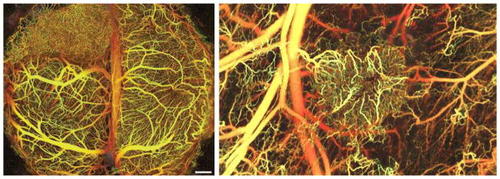
Tumor angiogenesis imaging. Vasculature in the brain (left) and the dorsal skin (right) visualized using IR frequencies to image deeper into tissue; blood flow creates the contrast, so it is noninvasive (from [485])

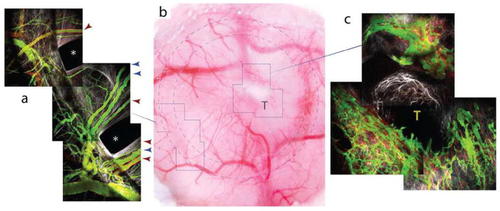
MMTV tumor vasculature in the cranial window pillar TIC. a MPLSM/SHG image of the indicated region in the bright-field image (b). Near the edge of the PDMS, the vasculature extends radially into the central chamber. At this time point (day 7 after implantation), the vasculature is mature and has normal morphology in the regions far from the tumor. Four feeding arterioles (red arrowheads) and three venules (blue arrowheads) are indicated. These vessels have significant flow and have acquired smooth muscle cells in their walls (red, αSMA+-DsRed). Note that the arterioles generally have more αSMA signal than the venules, as expected. c The vasculature near the growing tumor has dramatically different morphology and flow, as observed in other animal models and human tumors. The tumor was not fluorescently labeled in this group, but is visible as the mass extending from the central tumor (T) in b (from [493])

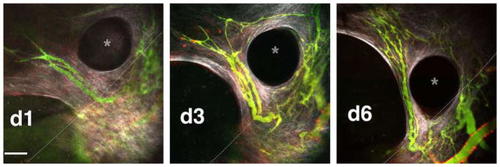
Imaging of vasculature in the cranial window preparation. Vascular sprouts entering a cranial window tissue isolation chamber. Time sequence of new vasculature (green) migrating toward the top left into a cranial window TIC, past the edge of the PDMS disk (dashed line) (imaged using MPLSM and SHG). Alignment of collagen fibers (white) is evident, and alpha-SMA+ cells can be seen on the PDMS surface (red). The vasculature (green, FITC-dextran) extends by forming perfused loops and sprouts. As the matrix remodels, the vessels also remodel as they advance. a: D1: day 1, D3: day 3, D6: day 6 post-TIC implantation. A pillar structure, which defines the height of the chamber, is indicated with * (from [493])

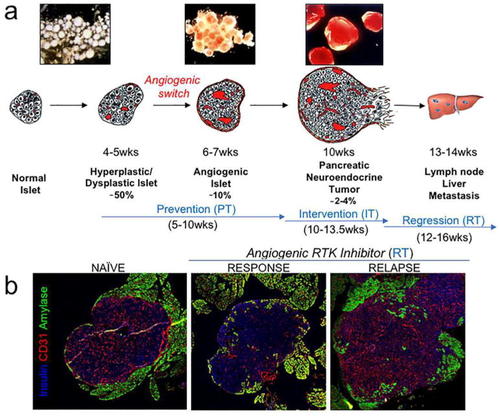
RIP1-Tag2 mouse model. a Multi-step progression to tumors in RIP-Tag2. Although oncogene expression begins during embryonic development (E8.5), the pancreatic islets initially have a normal anatomical and histological appearance (“normal” stage). Beginning at 4–5 weeks of age, hyperplastic and dysplastic islets begin to appear to comprise about 50% of islets by 10 weeks. Angiogenic islets appear beginning around 6 weeks of age, and represent 10% of all islets at 10.5 weeks. Angiogenic islets are recognized by their dilated blood vessels and microhemorrhages. Tumors form beginning at 9–10 weeks and represent 2–4% of all the islets by 14 weeks. About half of the tumors at end stage evidence either focal or widespread invasion to the surrounding acinar tissue. RIP-Tag2 mice die at approximately 14 weeks of age primarily due to hyperinsulinemia. b Anti-angiogenic Therapy Response and Relapse. Tumors treated with anti-angiogenic therapy using an RTK inhibitor starting at 12–15 weeks “Response,” or 12–20 weeks “Relapse,” when vessels have significantly rebounded. Tumors are stained with anti-insulin in blue, vessels are stained with anti-CD31 in red, and surrounding exocrine pancreas is stained with amylase in green

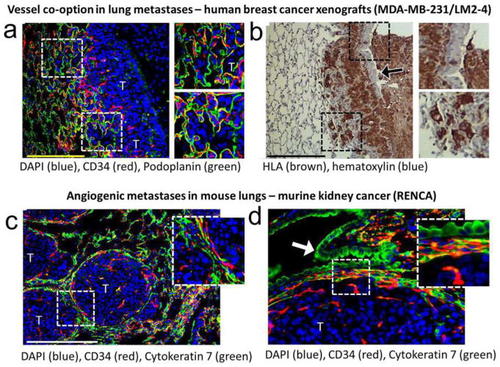
Visualization of vasculature in transplanted mouse models. Immunofluorescence and immunohistochemical staining of forma-lin-fixed mouse lung samples to enable differentiation between vessel co-option and angiogenesis in tumors. a, b Vessel co-opting tumors are observed in spontaneously formed lung metastases from mice with orthotopically implanted then surgically resected MDA-MB-231/LM2–4 breast tumors. In a sections are stained for alveolar cell marker podoplanin, EC marker CD34 and nuclei marker DAPI. Tumor cells can be seen filling alveolar spaces along the border and incorporating alveolar capillaries into the tumor core. In b is the corresponding section stained for HLA human cell marker and hematoxylin to show the presence of tumor cells with respect to host stroma and lung parenchyma. A bronchiole is also seen to be taken into the tumor and gradually filled with tumor cells. The tumor border is irregular. c, d Angiogenic growth is observed in spontaneously formed lung metastases from mice bearing intra-renal implanted RENCA tumor cells that later underwent nephrectomy. Sections are stained for alveolar and bronchial epithelium cell marker cytokeratin 7, EC marker CD34 and nuclei marker DAPI. RENCA tumors grow in “cannonball” shape, compressing lung tissue and excluding them. The lung–tumor interface of another nodule is shown at high magnification in d. Lung tissue is compressed or “pushed” aside to allow tumor expansion. The tumor border is smooth, and microvessels are not associated with alveolar epithelium within the tumor. Scale bar represents 200 μm. Regions in dashed boxes are expanded on the right. “T” = tumor. Arrow = columnar bronchial epithelium

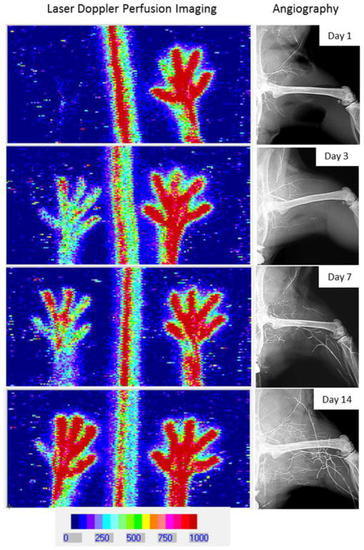
Laser Doppler perfusion imaging and angiography of blood flow. Analysis of blood flow recovery in time by laser Doppler perfusion imaging (left panels) and angiography (right panels)

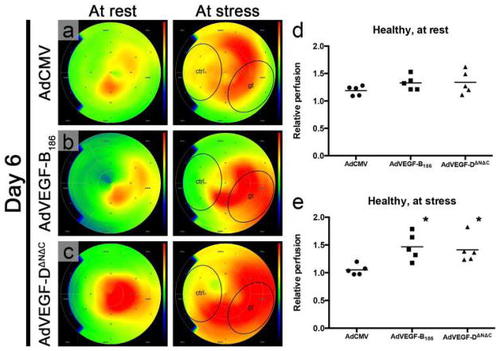
Perfusion imaging is crucial in detecting functional changes in the vasculature. In normoxic pig myocardium 6 days after intramyocardial AdVEGF-B186 and AdVEGF-DΔNΔC gene transfer, myocardial perfusion is increased at stress conditions in the treated region (gt) as measured with PET. Color scale is absolute; darkest blue is 0 ml/min/g, green is 1.5 ml/min/g, and deepest red is 3.0 ml/min/g or over (ac). In control AdCMV group, relative perfusion, i.e., the ratio of absolute perfusion in the gene transfer area to that of the control anteroseptal area, did not increase at stress, whereas with both AdVEGF-B186 and AdVEGF-DΔNΔC, the relative perfusion was higher in comparison with the control group. Relative perfusion at rest was 12 and 13% and at stress 40 and 34% higher for AdVEGF-B186 and AdVEGF-DΔNΔC, respectively d, e. Ad, adenoviral; CMV, cytomegalovirus; ctrl, control anteroseptal area; gt, posterolateral gene transfer area [654]

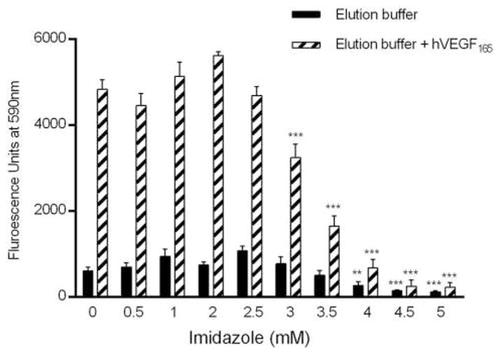
Effects of imidazole on endothelial cell proliferation. BCECs (bovine choroidal microvascular endothelial cells) were cultured in the presence of low-glucose DMEM in the presence of 10% bovine calf serum as previously described [645]. Elution buffer was tested up to a final concentration of 5 mM imidazole, with or without 10 ng/ml VEGF165. Note that the concentration of imidazole typically used to elute His-tagged proteins is 500 mM. After 5–6 days, cell proliferation was determined by fluorescence readings at 590 nm. Asterisks denote significant differences compared to no addition (0) groups by t test (***p < 0.001, **p < 0.01)

Acknowledgments
This image is the copyrighted work of the attributed author or publisher, and ZFIN has permission only to display this image to its users. Additional permissions should be obtained from the applicable author or publisher of the image. Full text @ Angiogenesis