FIGURE

Fig. 12

ID
ZDB-FIG-190801-15
Publication
Nowak-Sliwinska et al., 2018 - Consensus guidelines for the use and interpretation of angiogenesis assays
Other Figures
All Figure Page
Back to All Figure Page
Fig. 12

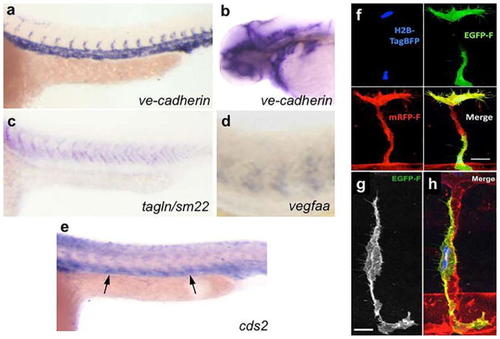
Assessing EC autonomous gene function in zebrafish. ae Whole mount in situ hybridization of 24–48 hpf zebrafish embryos. abve-cadherin labeling of the vasculature in the trunk (a) and head (b) of a zebrafish embryo showing vascular-specific labeling. cdtagln/sm22 (c) and vegfa [308] (d) showing labeling of non-vascular (somitic) tissues in the trunk. e cds2 [309] labeling of both vascular (arrows) and non-vascular tissues. f Confocal micrograph of a growing trunk intersegmental vessel in a 32 hpf Tg(kdrl:mRFP-F)y286 embryo (red vessels), mosaically expressing Tol2(fli1a:H2B-TagBFP-p2A-egfp-F) transgene (blue EC nuclei, green EC cytoplasm), showing blue, green, and red fluorescent channels and all three merged. gh Higher-magnification images of GFP fluorescence (g) and merged GFP/BFP/RFP fluorescence (h) in a 48 hpf Tg(kdrl:mRFP-F)y286 transgenic animals mosaically expressing a Tol2(fli1a:H2B-TagBFP-p2A-egfp-F) transgene in a single EC in a trunk intersegmental vessel. Scale bars = 20 μm (f), 10 μm (gh). Images in panels fh are from Ref. [649]

Expression Data

Expression Detail
Antibody Labeling
Phenotype Data

Phenotype Detail
Acknowledgments
This image is the copyrighted work of the attributed author or publisher, and ZFIN has permission only to display this image to its users. Additional permissions should be obtained from the applicable author or publisher of the image. Full text @ Angiogenesis