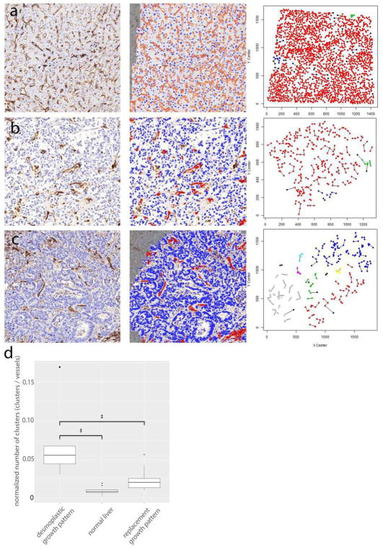
Microvessel density and histopathological growth patterns. a Unsupervised spatial modeling of the blood vessel pattern in normal liver shows a low number of clusters per number of vessel profiles. A selected region of interest (ROI) at the tumor–liver interface of normal liver in CD31-stained tissue is shown (left). The Blood Vessel Analysis algorithm of Definiens™ segments and classifies blood vessel objects (orange) and nuclei (blue) (mid). The Cartesian coordinates (x, y) of the centroids of all vessel objects in one ROI were used in a simplified “SeedLink” clustering method [646] (right). Centroids with the same color (e.g., red) belong to the same cluster. b Unsupervised spatial modeling of the blood vessel pattern in a colorectal cancer liver metastasis with a replacement growth pattern shows a low number of clusters per number of vessel profiles. A selected region of interest (ROI) at the tumor–liver interface of replacement growth pattern in CD31-stained tissue is shown (left). The Blood Vessel Analysis algorithm of Definiens™ segments and classifies blood vessel objects (red) and nuclei (blue) (mid). The Cartesian coordinates (x, y) of the centroids of all vessel objects in one ROI were used in a simplified “SeedLink” clustering method [646] (right). Centroids with the same color (e.g. red) belong to the same cluster. c Unsupervised spatial modeling of the blood vessel pattern in a colorectal cancer liver metastasis with a desmoplastic growth pattern shows a high number of clusters per number of vessel profiles. A selected region of interest (ROI) at the tumor–liver interface of desmoplastic growth pattern in CD31-stained tissue is shown (left). The Blood Vessel Analysis algorithm of Definiens™ segments and classifies blood vessel objects (red) and nuclei (blue) (mid). The Cartesian coordinates (x, y) of the centroids of all vessel objects in one ROI were used in a simplified “SeedLink” clustering method [646] (right). Centroids with the same color (e.g., red) belong to the same cluster. d Tukey boxplots of the normalized number of clusters of blood vessel objects for the desmoplastic growth pattern, the replacement growth pattern, and normal liver. There was a statistically significant difference between the growth patterns as determined by one-way ANOVA [F(2,22) = 10.8, p < 0.001]. A post hoc Tukey test showed that the number of clusters divided by number of vessel objects was significantly different between the desmoplastic growth pattern and the replacement growth pattern (p < 0.05, ‡), but also between the desmoplastic growth pattern and normal liver (p < 0.001,‡). However, no difference was found between the replacement growth pattern and normal liver (p > 0.05). Outliers are plotted as points (·) and extreme values are plotted as asterisks (*)
|
