
Fig. 11
- ID
- ZDB-FIG-190801-14
- Publication
- Nowak-Sliwinska et al., 2018 - Consensus guidelines for the use and interpretation of angiogenesis assays
- Other Figures
- All Figure Page
- Back to All Figure Page
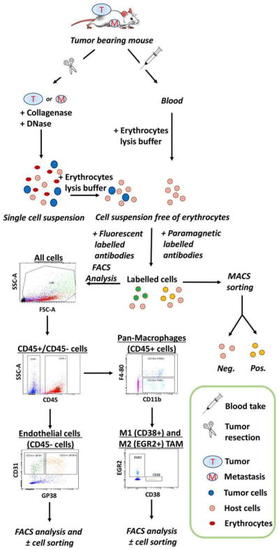
Representative flow-chart of flow cytometry and cell sorting experiments. Overview of samples collection (tumors, organs bearing metastasis, and blood) from mice and the procedure to obtain a single-cell suspension after tissue dissociation, erythrocytes lysis, and cell labeling with fluorescent or paramagnetic-coupled antibodies. Analysis of blood-circulating cells only requires a red blood cell lysis prior to incubation with antibodies of interest. Intracellular antigens can be detected by adding a cell permeabilization step. Fluorescent labeled cells are analyzed by flow cytometry and sorted by FACS while cells labeled with paramagnetic-coupled antibodies can be sorted by MACS. MACS can be used to pre-enrich cells for subsequent FACS sorting. Cell populations of interest are identified in by dot plots analysis of collected data |