
FIGURE
Fig. 16
- ID
- ZDB-FIG-190801-19
- Publication
- Nowak-Sliwinska et al., 2018 - Consensus guidelines for the use and interpretation of angiogenesis assays
- Other Figures
- All Figure Page
- Back to All Figure Page
Fig. 16
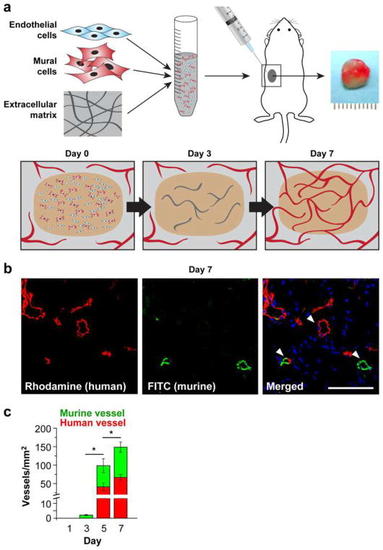
In vivo vascular network formation assay. |
Expression Data
Expression Detail
Antibody Labeling
Phenotype Data
Phenotype Detail
Acknowledgments
This image is the copyrighted work of the attributed author or publisher, and
ZFIN has permission only to display this image to its users.
Additional permissions should be obtained from the applicable author or publisher of the image.
Full text @ Angiogenesis