IMAGE

Fig. 16

ID
ZDB-IMAGE-190801-19
Source
Figures for Nowak-Sliwinska et al., 2018
Image
Figure Caption

Fig. 16

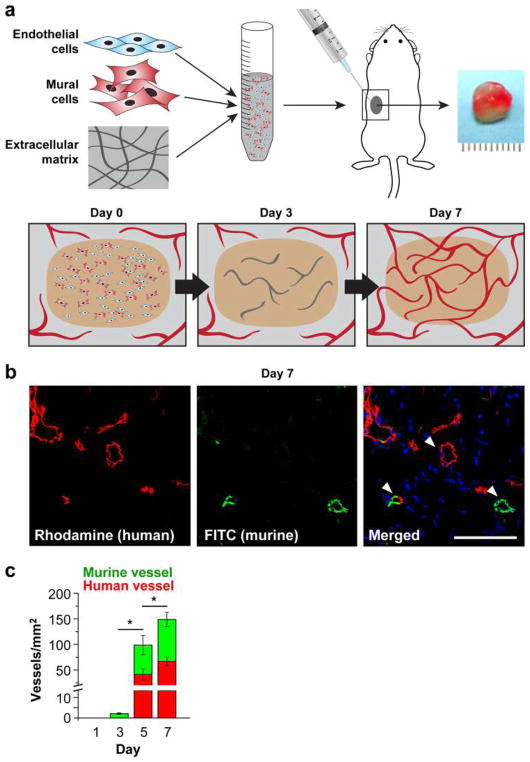
In vivo vascular network formation assay. a Schematic of the two-cell model. b Tail vein injection of rhodamine-UEA-I and FITC-GS-B4 labels perfused human (red) and murine (green) vessels on day 7 after cell/Matrigel subcutaneous injection. c) Quantification of lectin-labeled human and murine vessels shows that perfused human vessels present at day 5 and day 7

Acknowledgments
This image is the copyrighted work of the attributed author or publisher, and ZFIN has permission only to display this image to its users. Additional permissions should be obtained from the applicable author or publisher of the image. Full text @ Angiogenesis