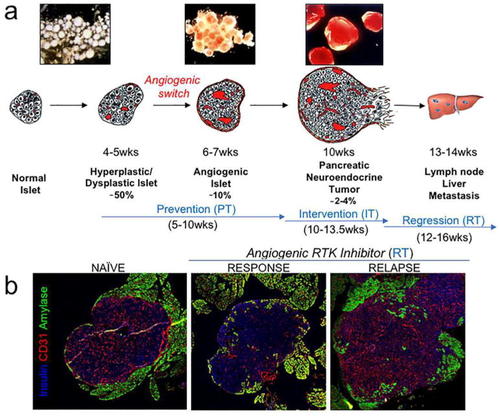
RIP1-Tag2 mouse model. a Multi-step progression to tumors in RIP-Tag2. Although oncogene expression begins during embryonic development (E8.5), the pancreatic islets initially have a normal anatomical and histological appearance (“normal” stage). Beginning at 4–5 weeks of age, hyperplastic and dysplastic islets begin to appear to comprise about 50% of islets by 10 weeks. Angiogenic islets appear beginning around 6 weeks of age, and represent 10% of all islets at 10.5 weeks. Angiogenic islets are recognized by their dilated blood vessels and microhemorrhages. Tumors form beginning at 9–10 weeks and represent 2–4% of all the islets by 14 weeks. About half of the tumors at end stage evidence either focal or widespread invasion to the surrounding acinar tissue. RIP-Tag2 mice die at approximately 14 weeks of age primarily due to hyperinsulinemia. b Anti-angiogenic Therapy Response and Relapse. Tumors treated with anti-angiogenic therapy using an RTK inhibitor starting at 12–15 weeks “Response,” or 12–20 weeks “Relapse,” when vessels have significantly rebounded. Tumors are stained with anti-insulin in blue, vessels are stained with anti-CD31 in red, and surrounding exocrine pancreas is stained with amylase in green
|
