IMAGE

Fig. 1

ID
ZDB-IMAGE-190801-3
Source
Figures for Nowak-Sliwinska et al., 2018
Image
Figure Caption

Fig. 1

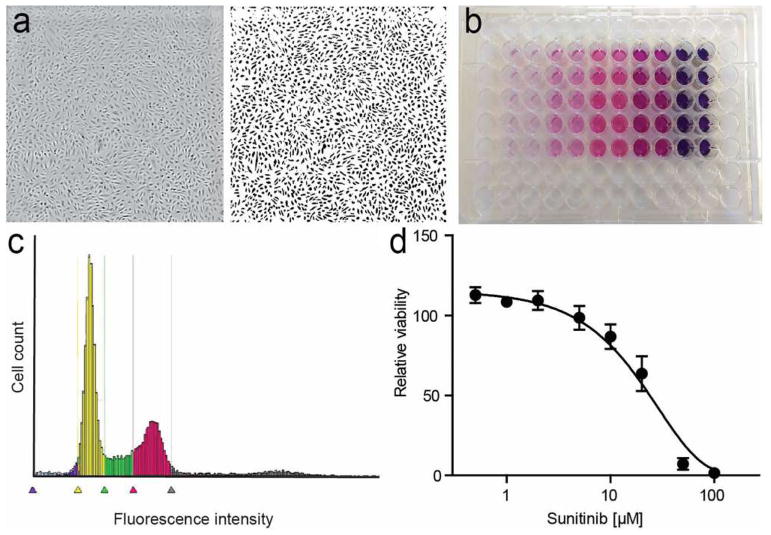
Endothelial cell proliferation assays. a Phase-contrast image (left) and binarized image of HUVEC grown in a regular 96-well plate. Simple software solutions can be used to count features in the image. b Example of MTT assay, with color intensity correlating with cell number. c DNA staining profile of HUVEC using PI, measured on a plate cytometer. d Cell viability of HUVEC exposed to sunitinib, measured using a luminescent assay

Acknowledgments
This image is the copyrighted work of the attributed author or publisher, and ZFIN has permission only to display this image to its users. Additional permissions should be obtained from the applicable author or publisher of the image. Full text @ Angiogenesis