IMAGE

Fig. 19

ID
ZDB-IMAGE-190801-21
Source
Figures for Nowak-Sliwinska et al., 2018
Image
Figure Caption

Fig. 19

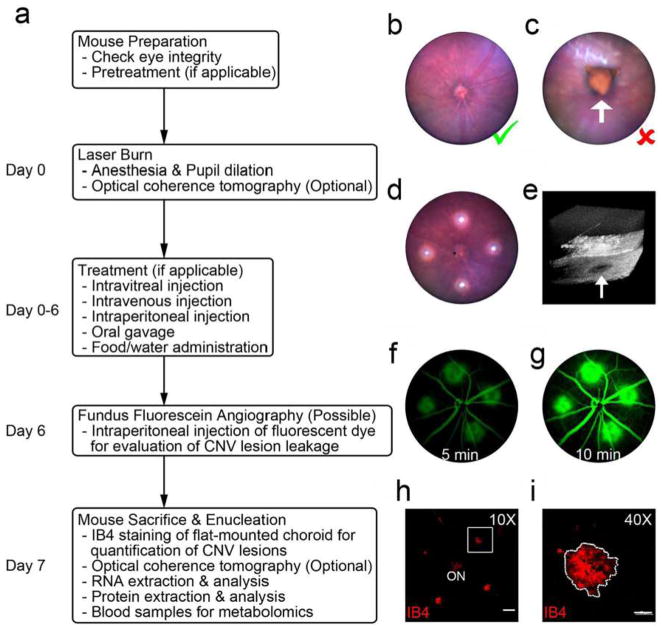
Experimental flowchart of the image-guided laser-induced CNV model and data collection. a Overview of the procedure for CNV induction involving mouse preparation and followed by experimental treatment, sample preparation, and analysis. b Representative image of normal fundus (Green check mark). c Representative image of anomalous structure (white arrow) in the eye, which is not suitable for laser photocoagulation (Red X). d Representative image of normal fundus with four laser burns shown as bright white spots. e Representative image of a successful laser burn (white arrow) with 3D optical coherence tomography. f, g Representative ocular fundus fluorescein angiography images at 5 and 10 min after the injection of fluorescent dye at day 6 after laser burn. h Representative images of flat-mounted choroid with IB4 staining at day 7 after laser photocoagulation. Scale bar: 200 μm. ON: optic nerve. (i) Higher magnification of the laser-induced CNV lesion highlighted in panel H. Scale bar: 50 μm. Reproduced with permission from [467]

Acknowledgments
This image is the copyrighted work of the attributed author or publisher, and ZFIN has permission only to display this image to its users. Additional permissions should be obtained from the applicable author or publisher of the image. Full text @ Angiogenesis