- Title
-
A novel zebrafish intestinal tumor model reveals a role for cyp7a1-dependent tumor-liver crosstalk in causing adverse effects on the host.
- Authors
- Enya, S., Kawakami, K., Suzuki, Y., Kawaoka, S.
- Source
- Full text @ Dis. Model. Mech.
|
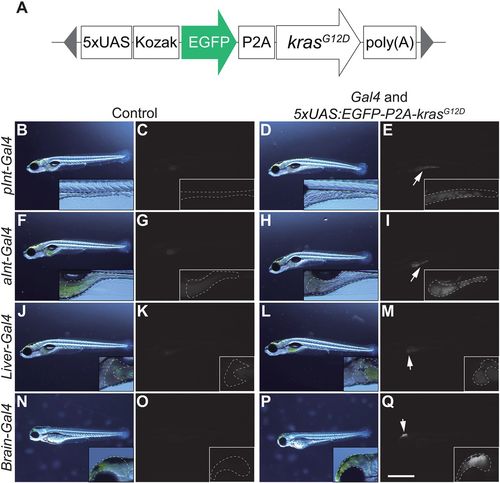
Screening for Gal4 lines that induce outgrowth of target organs when crossed with Tg(5×UAS:EGFP-P2A-krasG12D). (A) The structure of 5×UAS:EGFP-P2A-krasG12D. The gray triangles represent the sequence recognized by Tol2 transposases. (B-Q) Screening for a Gal4 line that is potent to induce outgrowth of target organs. Images of the sibling control (left) and EGFP-krasG12D-expressing larvae (right) are shown. Higher-magnification images are also presented. Images on the left for each group are bright-field images, whereas the others are fluorescence images (EGFP). Target organs are outlined by a dashed white line for (B-E) gSAIzGFFD1105A (pInt-Gal4) (7 dpf), (F-I) gSAIzGFFM103B (aInt-Gal4) (7 dpf), (J-M) gSAIzGFFD886A (Liver-Gal4) (7 dpf) and (N-Q) gSAGFF138A (Brain-Gal4) (3 dpf). Larvae without EGFP expression from the same clutch were used as sibling controls. White arrows indicate organs that express the EGFP-krasG12D transgene. Scale bar: 1 mm. Data are representative of at least two independent experiments. EXPRESSION / LABELING:
PHENOTYPE:
|
|
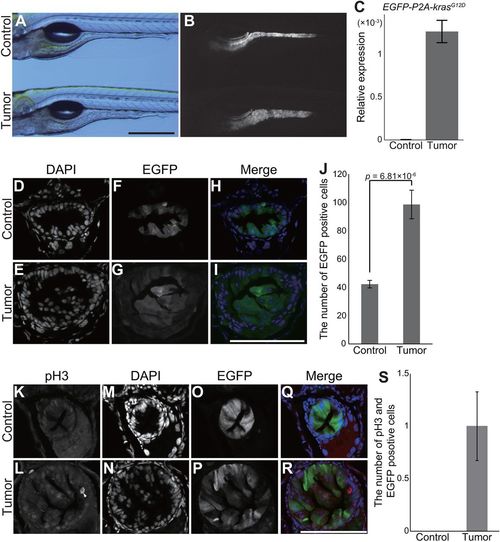
pInt-Gal4-driven krasG12D expression leads to abnormal proliferation of intestinal cells. (A,B) Representative images of tumor-bearing larvae [Tg(pInt-Gal4)+/Tg; Tg(5×UAS:EGFP-P2A-krasG12D)+/Tg] and the sibling controls [Tg(pInt-Gal4)+/Tg; Tg(UAS:EGFP)+/Tg] at 5 dpf. Bright-field (A) and EGFP (B) images are shown. Scale bar: 500 µm. (C) qPCR analysis for the EGFP-P2A-krasG12D transgene in the sibling controls and tumor-bearing larvae. The scores are normalized to expression of rpl13a. The data harbors three biological replicates. Error bars represent means±s.e.m. (D-I) Representative images of DAPI staining for transversal sections of the posterior intestine of tumor-bearing larvae and the sibling controls at 5 dpf. DAPI (D,E) and EGFP (F,G) images are shown. In the merged images (H,I), DAPI and EGFP signals are shown in blue and green, respectively. Scale bar: 100 µm. (J) The number of EGFP- and DAPI-positive intestinal cells. The number of nuclei was manually counted from a single section per individual larva. The data harbors 7 and 11 biological replicates from tumor-bearing larvae and the sibling controls, respectively. Error bars represent means±s.e.m. Statistical significance was tested using Student's t-test (unpaired, one-tailed). (K-R) Representative images of fluorescent immunohistochemistry for phosphorylated histone H3 (pH3) in transversal sections of the posterior intestine of tumor-bearing larvae and the sibling controls at 5 dpf. pH3 (K,L), DAPI (M,N) and EGFP (O,P) images are shown. White arrow indicates intestinal cells positive for pH3, EGFP and DAPI. In the merged images (Q,R), pH3, DAPI and EGFP signals are shown in red, blue and green, respectively. Scale bar: 100 µm. (S) The number of intestinal cells positive for pH3, EGFP and DAPI. The number of pH3-, EGFP- and DAPI-positive cells was counted from a single section per individual larva. The data harbors 8 and 6 biological replicates from tumor-bearing larvae and the sibling controls, respectively. Error bars represent means±s.e.m. Data are representative of at least two independent experiments. PHENOTYPE:
|
|
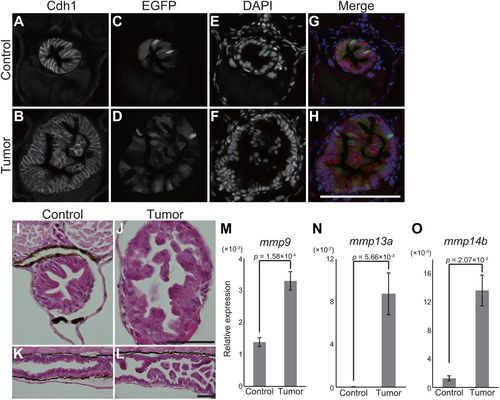
pInt-Gal4 driven krasG12D expression results in intestinal epithelial tumor. (A-H) Representative images of fluorescent immunohistochemistry for Cdh1 in transversal sections of the posterior intestine of the sibling controls and tumor-bearing larvae at 5 dpf. Cdh1 (A,B), EGFP (C,D) and DAPI (E,F) images are shown. In the merged images (G,H), Cdh1, EGFP and DAPI signals are shown in red, green and blue, respectively. Scale bar: 100 µm. (I-L) Representative images of HE-stained intestinal sections of the sibling controls (I,K) and tumor-bearing larvae (J,L) at 5 dpf. Transversal and sagittal sections are shown in I,J and K,L, respectively. Scale bars: 50 µm. (M-O) qPCR analysis for mmp genes in the intestine at 9 dpf. The scores are normalized to expression of rpl13a. The data harbors 5 biological replicates, each containing the intestines from 5 larvae. Error bars represent means±s.e.m. Statistical significance was tested using Student's t-test (unpaired, one-tailed). Data are representative of at least two independent experiments. |
|
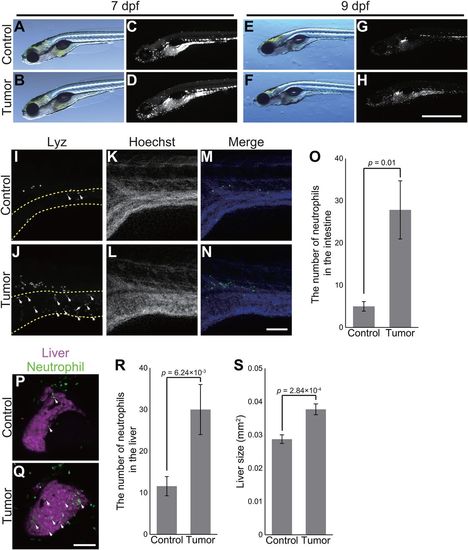
The zebrafish intestinal tumor instigates local and distant inflammation. (A-H) Representative images of the sibling controls and tumor-bearing larvae carrying Tg(lyz:EGFP) transgene at 7 and 9 dpf. Bright-field (A,B,E,F) and EGFP (C,D,G,H) images are shown. Scale bar: 1 mm. (I-N) Representative images of whole-mount fluorescent immunohistochemistry for Lyz in the intestines of the sibling controls and tumor-bearing larvae at 7 dpf. Lyz (I,J) and Hoechst 33342 (K,L) images are shown. (I,J) The intestine is shown by dashed yellow lines. (M,N) In the merged images, Lyz and Hoechst 33324 signals are shown in green and blue, respectively. White arrows indicate representative neutrophils in the intestine. Scale bar: 100 µm. (O) The number of neutrophils in the intestines of the sibling controls and tumor-bearing larvae. The data harbors 6 biological replicates. Error bars represent means±s.e.m. Statistical significance was tested using Student's t-test (unpaired, one-tailed). (P,Q) Representative images of the livers of the sibling controls and tumor-bearing larvae carrying Tg(lyz:EGFP) and Tg(fabp10a:mCherry) at 7 dpf. Neutrophils and the liver are shown by green and magenta, respectively. White arrows indicate representative neutrophils in the liver. Scale bar: 100 µm. (R) The number of neutrophils in the livers of the sibling controls and tumor-bearing larvae at 7 dpf. The data harbors 12 biological replicates. Error bars represent means±s.e.m. Statistical significance was tested using Student's t-test (unpaired, one-tailed). (S) Liver size of the sibling controls and tumor-bearing larvae at 7 dpf. Liver size was measured from Tg(fabp10a:mCherry) images using ImageJ software. The data harbors 12 biological replicates. Error bars represent means±s.e.m. Statistical significance was tested using Student's t-test (unpaired, two-tailed). Data are representative of at least two independent experiments. PHENOTYPE:
|
|
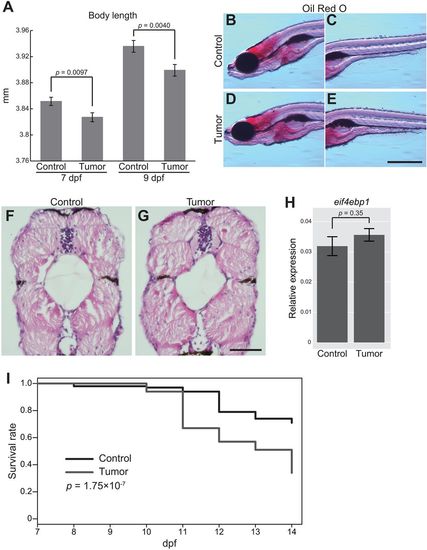
The zebrafish intestinal tumor causes the systemic growth defect and organismal death. (A) Body length data of the sibling controls and tumor-bearing larvae at 7 and 9 dpf. The number of larvae used is 163 (7 dpf control larvae), 155 (7 dpf tumor-bearing larvae), 154 (9 dpf control larvae) and 154 (9 dpf tumor-bearing larvae). Data from three independent clutches are pooled. Data from each clutch are shown in Fig. S6. Error bars represent means±s.e.m. Statistical significance was tested using Student's t-test (unpaired, two-tailed). (B-E) Representative images of Oil Red O staining for the sibling controls (B,C) and tumor-bearing larvae (D,E) at 9 dpf. Scale bar: 500 µm. Red-stained areas represent total lipids in larvae. (F,G) Representative images of HE-stained transversal body sections for the sibling controls (F) and tumor-bearing larvae (G) at 9 dpf. Scale bar: 50 µm. (H) qPCR analysis for eif4ebp1 in the body (without the intestine or intestinal tumor) in the sibling controls and tumor-bearing larvae at 9 dpf. Scores are normalized to expression of rpl13a. The data harbors 5 biological replicates, each containing 5 larvae. Error bars represent means±s.e.m. Statistical significance was tested using Student's t-test (unpaired, two-tailed). (I) Survival rates of the sibling controls and tumor-bearing larvae from 7 to 14 dpf are shown by the Kaplan–Meier curve. Data were pooled from three independent experiments. The total number of analyzed larvae is 100 each. Statistical significance was tested using the log-rank test. Data are representative of at least two independent experiments, except I. EXPRESSION / LABELING:
PHENOTYPE:
|
|
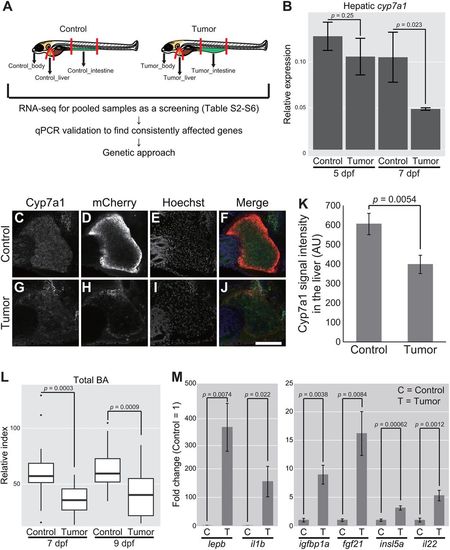
Whole-organism gene expression analysis identifies tumor–liver crosstalk characterized by hepatic cyp7a1 and total BA. (A) Schematic representation of zebrafish dissection in our RNA-seq experiments followed by qPCR validation and genetic approaches. (B) Expression of cyp7a1 in the liver. The scores are normalized to expression of rpl13a. The data harbors 3 biological replicates, each containing 7 larvae for 5 dpf and 5 larvae for 7 dpf, respectively. Error bars represent means±s.e.m. Statistical significance was tested using Student's t-test (unpaired, one-tailed). (C-J) Representative images of whole-mount fluorescent immunohistochemistry for Cyp7a1 in the livers of the sibling controls and tumor-bearing larvae carrying Tg(fabp10a:mCherry) at 7 dpf. Cyp7a1 (C,G), mCherry (D,H) and Hoechst 33342 (E,I) images are shown. In the merged images (F,J), Cyp7a1, mCherry and Hoechst signals are shown in green, red and blue, respectively. Scale bar: 100 µm. (K) The averages for Cyp7a1 signal intensity in the liver of the sibling controls and tumor-bearing larvae at 7 dpf are shown. The number of larvae used is 14 and 11 for the sibling controls and tumor-bearing larvae, respectively (one independent experiment). Error bars represent means±s.e.m. Statistical significance was tested using Student's t-test (unpaired, one-tailed). (L) Measurement for systemic BA levels at 7 and 9 dpf. The number of larvae used is 19 (7 dpf control larvae), 19 (7 dpf tumor-bearing larvae), 22 (9 dpf control larvae) and 18 (9 dpf tumor-bearing larvae). The scores are relative index determined using bile acids as standards (see Materials and Methods). Statistical significance was tested using Student's t-test (unpaired, one-tailed). (M) Expression of a set of secreted protein-coding genes in the intestinal tumor and normal intestine. The scores are normalized to expression of rpl13a and to the sibling controls (=1). The data harbors 5 biological replicates, each containing 5 larvae. Error bars represent means±s.e.m. Data are representative of at least two independent experiments, except C-K. |
|
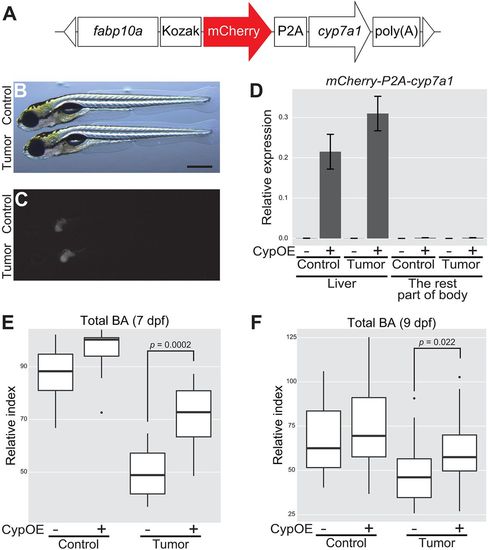
Overexpression of cyp7a1 in the liver restores the amount of total BA in tumor-bearing larvae. (A) The structure of fabp10a:mCherry-P2A-cyp7a1. The white triangles represent the recognition sequence by I-SceI meganucleases. (B,C) Representative images of mCherry-P2A-cyp7a1 transgene expression in the liver. Control refers to Tg(pInt-Gal4)+/Tg; Tg(UAS:EGFP)+/Tg; Tg(fabp10a:mCherry-P2A-cyp7a1)+/Tg, and tumor-bearing larvae to Tg(pInt-Gal4)+/Tg; Tg(5×UAS:EGFP-P2A-krasG12D)+/Tg; Tg(fabp10a:mCherry-P2A-cyp7a1)+/Tg. Scale bar: 500 µm. Bright-field (B) and mCherry (C) images are shown. (D) qPCR analysis for detecting mCherry-P2A-cyp7a1 mRNA in the liver and the rest of the body at 7 dpf. The scores are normalized to expression of rpl13a. The data harbors 3 biological replicates, each containing 3 larvae. Error bars represent means±s.e.m. CypOE – and + indicate the absence and presence of Tg(fabp10a:mCherry-P2A-cyp7a1), respectively. (E,F) Measurement for systemic BA levels at 7 (n=10 per a group) and 9 (n=30-31 per a group) dpf. The scores are relative index determined using bile acids as standards (see Materials and Methods). Statistical significance was tested using Student's t-test (unpaired, one-tailed). Data are representative of at least two independent experiments. PHENOTYPE:
|
|
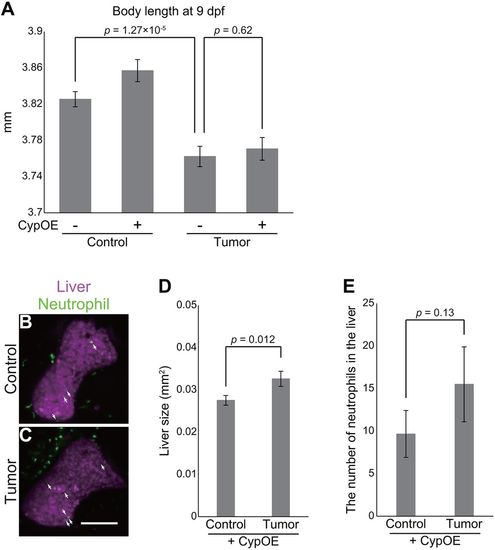
Overexpression of cyp7a1 in the liver ameliorates tumor-induced liver inflammation. (A) Body length data of the sibling controls and tumor-bearing larvae at 9 dpf in the Tg(fabp10a:mCherry-P2A-cyp7a1) background. The number of larvae used is 79 (control larvae), 73 [control larvae with Tg(fabp10a:mCherry-P2A-cyp7a1)], 81 (tumor-bearing larvae) and 74 [tumor-bearing larvae with Tg(fabp10a:mCherry-P2A-cyp7a1)]. Error bars represent means±s.e.m. Statistical significance was tested using Student's t-test (unpaired, two-tailed). CypOE − and + indicate the absence and presence of Tg(fabp10a:mCherry-P2A-cyp7a1), respectively. (B,C) Representative images of the livers of the sibling controls and tumor-bearing larvae carrying Tg(lyz:EGFP) and Tg(fabp10a:mCherry-P2A-cyp7a1) at 7 dpf. Neutrophils and the liver are shown by green and magenta, respectively. Scale bar: 100 µm. White arrows indicate representative neutrophils. (D) Liver size and (E) the number of neutrophils of the sibling controls and tumor-bearing larvae carrying Tg(lyz:EGFP) and Tg(fabp10a:mCherry-P2A-cyp7a1) at 7 dpf. Liver size was measured from Tg(fabp10a:mCherry-P2A-cyp7a1) images using ImageJ software. The data harbors 18 biological replicates (pooled from two independent experiments). Error bars represent means±s.e.m. Statistical significance was tested using Student's t-test (unpaired, one-tailed). Data are representative of at least two independent experiments, except D,E. |
|
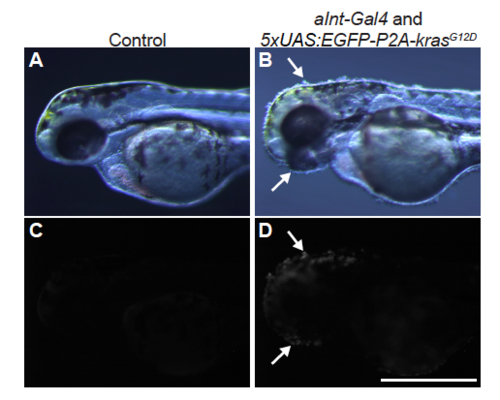
aInt-Gal4 is expressed in the epidermis at 2 dpf Bright filed (A, B) and EGFP (C, D) images of the sibling controls and EGFP-P2A-krasG12D-expressing larvae driven by gSAIzGFFM103B (aInt-Gal4) at 2 dpf. White arrows indicate EGFP-P2A-krasG12D-expressing cells. Scale bar represents 500 m. |
|
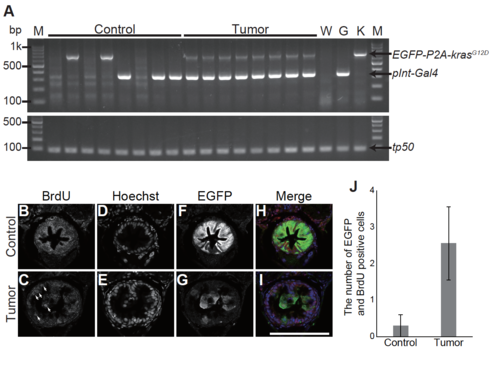
Characterization of the pInt-Gal4-driven tumor model (A) A gel image of genotyping of tumor-bearing larvae. Band sizes detecting Tg(5xUAS:EGFP-P2A-krasG12D), Tg(pInt-Gal4) and tp53 are 701 bp, 345 bp and 88 bp, respectively. tp53 locus is used as a PCR control. M, DNA ladder marker: W, wild type larvae: G, parental Tg(pInt-Gal4) line: K, parental Tg(5xUAS:EGFP-P2A-krasG12D) line. (B)-(I) Representative images of fluorescent immunohistochemistry for BrdU and EGFP in transversal sections of the posterior intestine of the sibling controls and tumor bearing larvae at 5 dpf. BrdU (B, C), Hoechst33342 (D, E) and EGFP (F, G) images are shown. In the merged images (H, I), BrdU, Hoechst33342 and EGFP signals are shown in red, blue and green, respectively. White arrows indicate intestinal cells positive for BrdU, Hoechst33342, and EGFP. Scale bar indicates 100 m. (J) The number of BrdU and EGFP positive intestinal cells. The number of BrdU and EGFP positive cells was counted from single section per individual larva. The data harbors 10 and 9 biological replicates from the sibling controls and tumor-bearing larvae, respectively. Error bars represent s.e.m. |
|
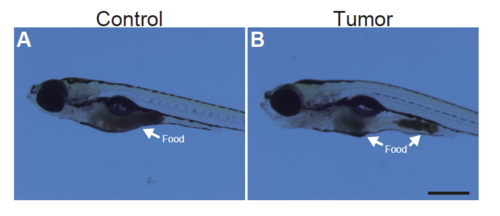
The intestinal rumen is not completely disrupted in tumor-bearing larvae Representative images of the sibling controls (A) and tumor-bearing larvae (B) at 9 dpf in the presence of foods in the intestine are shown. Scale bar represents 500 m. |
|
Whole mount in situ hybridization experiments for mmp genes qPCR results shown in Fig. 3M-3O were validated with the aid of in situ hybridization experiments for (A) mmp9, (B) mmp13a, and (C) mmp14b at 7 dpf. Increased expression of mmp13a (indicated by an arrow), the most highly expressed gene among these three, was confirmed. We could not detect expression of the other two genes in our hands probably due to lower expression levels. Shown are the representative images chosen from approximately 10 larvae. Scale bar indicates 500 m. |
|
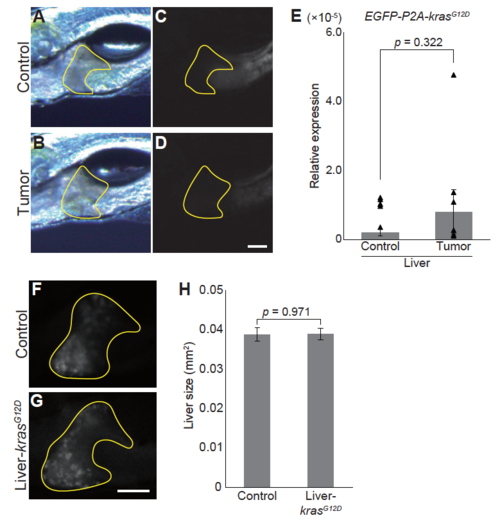
Hepatomegaly phenotype is not caused by leaky expression of krasG12D in the liver (A)-(D) Representative images for the livers of sibling controls and tumor-bearing larvae. Bright field images (A-B) and EGFP images (C-D) are shown. The liver is encircled by yellow lines. Scale bar indicates 100 m. (E) qPCR analysis for EGFP-P2A-krasG12D in the liver. Because the transgene lacked intron, total RNAs were DNase-treated. In addition, samples without reverse transcription were included. The scores are normalized to expression of rpl13a. The data harbors 6 biological replicates, each containing 5 larvae. Bars and dots represent averages and each value, respectively. Error bars represent s.e.m. Statistical significance was tested using student's t-test (unpaired, two-tailed). Although not excluded, note that there is a potential outlier in data from tumor-bearing larvae. (F)-(G) Representative RFP images for the livers of the sibling controls (F) and larvae expressing krasG12D driven by Liver-Gal4 (G) at 7 dpf. The liver is encircled by yellow lines. Scale bar indicates 100 m. (H) Liver size of the sibling controls and krasG12D-expressing larvae at 7 dpf. The liver was identified by the RFP signal and liver size was measured using ImageJ software. The data harbors 12 biological replicates. Error bars represent s.e.m. Statistical significance was tested using student's t-test (unpaired, two-tailed). In (A)-(E), sibling controls (Control) represent Tg(pInt-Gal4)+/Tg; Tg(UAS:EGFP)+/Tg and tumor-bearing larvae (Tumor) represent Tg(pInt-Gal4)+/Tg; Tg(5UAS:EGFP-P2Akras G12D)+/Tg. In (F)-(G), sibling controls (Control) represent Tg(Liver-Gal4)+/Tg; Tg(UAS:RFP)+/Tg and Liver-krasG12D represents Tg(Liver-Gal4)+/Tg; Tg(UAS:RFP)+/Tg; Tg(5UAS:EGFP-P2A-krasG12D)+/Tg. |

ZFIN is incorporating published figure images and captions as part of an ongoing project. Figures from some publications have not yet been curated, or are not available for display because of copyright restrictions. PHENOTYPE:
|

