
Fig. 1
- ID
- ZDB-IMAGE-180723-25
- Genes
- Publication
- Enya et al., 2018 - A novel zebrafish intestinal tumor model reveals a role for cyp7a1-dependent tumor-liver crosstalk in causing adverse effects on the host.
- All Figures
- Figures for Enya et al., 2018
|
Fig. 1
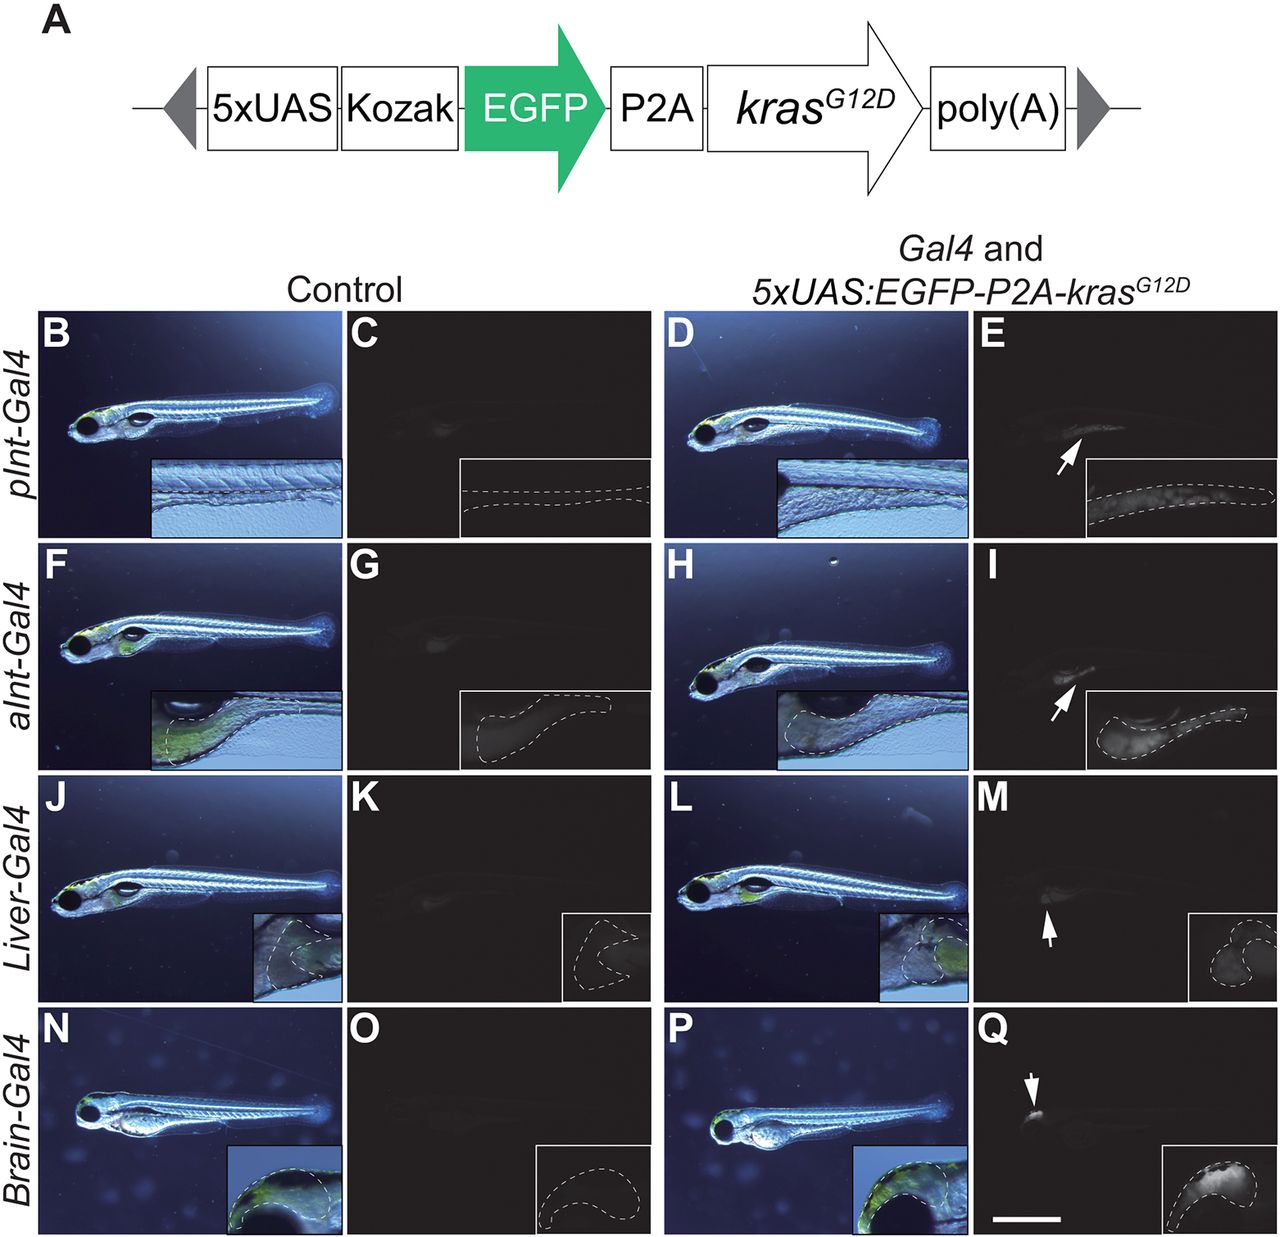
Screening for Gal4 lines that induce outgrowth of target organs when crossed with Tg(5×UAS:EGFP-P2A-krasG12D). (A) The structure of 5×UAS:EGFP-P2A-krasG12D. The gray triangles represent the sequence recognized by Tol2 transposases. (B-Q) Screening for a Gal4 line that is potent to induce outgrowth of target organs. Images of the sibling control (left) and EGFP-krasG12D-expressing larvae (right) are shown. Higher-magnification images are also presented. Images on the left for each group are bright-field images, whereas the others are fluorescence images (EGFP). Target organs are outlined by a dashed white line for (B-E) gSAIzGFFD1105A (pInt-Gal4) (7 dpf), (F-I) gSAIzGFFM103B (aInt-Gal4) (7 dpf), (J-M) gSAIzGFFD886A (Liver-Gal4) (7 dpf) and (N-Q) gSAGFF138A (Brain-Gal4) (3 dpf). Larvae without EGFP expression from the same clutch were used as sibling controls. White arrows indicate organs that express the EGFP-krasG12D transgene. Scale bar: 1 mm. Data are representative of at least two independent experiments.