
Fig. 7
- ID
- ZDB-FIG-180723-37
- Publication
- Enya et al., 2018 - A novel zebrafish intestinal tumor model reveals a role for cyp7a1-dependent tumor-liver crosstalk in causing adverse effects on the host.
- Other Figures
- All Figure Page
- Back to All Figure Page
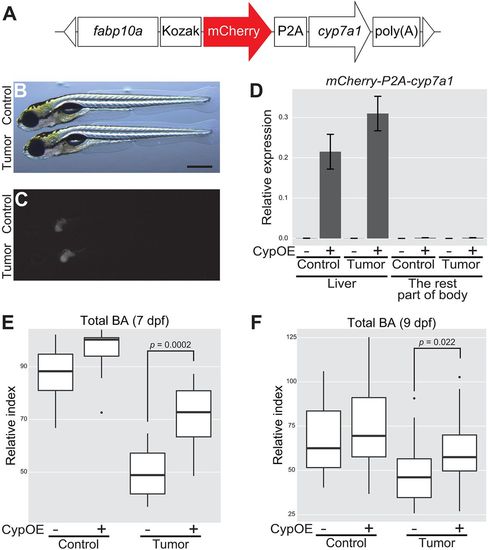
Overexpression of cyp7a1 in the liver restores the amount of total BA in tumor-bearing larvae. (A) The structure of fabp10a:mCherry-P2A-cyp7a1. The white triangles represent the recognition sequence by I-SceI meganucleases. (B,C) Representative images of mCherry-P2A-cyp7a1 transgene expression in the liver. Control refers to Tg(pInt-Gal4)+/Tg; Tg(UAS:EGFP)+/Tg; Tg(fabp10a:mCherry-P2A-cyp7a1)+/Tg, and tumor-bearing larvae to Tg(pInt-Gal4)+/Tg; Tg(5×UAS:EGFP-P2A-krasG12D)+/Tg; Tg(fabp10a:mCherry-P2A-cyp7a1)+/Tg. Scale bar: 500 µm. Bright-field (B) and mCherry (C) images are shown. (D) qPCR analysis for detecting mCherry-P2A-cyp7a1 mRNA in the liver and the rest of the body at 7 dpf. The scores are normalized to expression of rpl13a. The data harbors 3 biological replicates, each containing 3 larvae. Error bars represent means±s.e.m. CypOE – and + indicate the absence and presence of Tg(fabp10a:mCherry-P2A-cyp7a1), respectively. (E,F) Measurement for systemic BA levels at 7 (n=10 per a group) and 9 (n=30-31 per a group) dpf. The scores are relative index determined using bile acids as standards (see Materials and Methods). Statistical significance was tested using Student's t-test (unpaired, one-tailed). Data are representative of at least two independent experiments. |
| Fish: | |
|---|---|
| Observed In: | |
| Stage: | Days 7-13 |