
Fig. 2
- ID
- ZDB-FIG-180723-32
- Publication
- Enya et al., 2018 - A novel zebrafish intestinal tumor model reveals a role for cyp7a1-dependent tumor-liver crosstalk in causing adverse effects on the host.
- Other Figures
- All Figure Page
- Back to All Figure Page
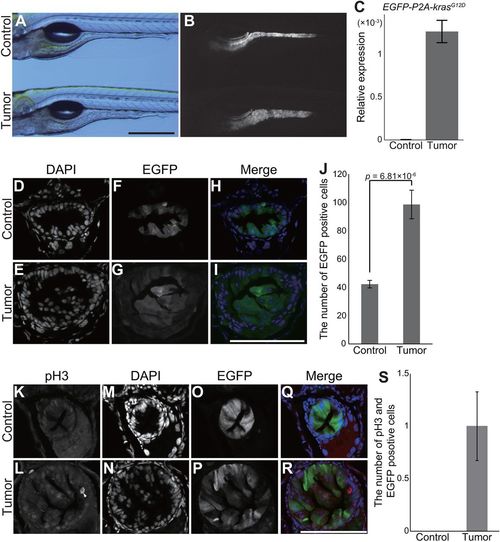
pInt-Gal4-driven krasG12D expression leads to abnormal proliferation of intestinal cells. (A,B) Representative images of tumor-bearing larvae [Tg(pInt-Gal4)+/Tg; Tg(5×UAS:EGFP-P2A-krasG12D)+/Tg] and the sibling controls [Tg(pInt-Gal4)+/Tg; Tg(UAS:EGFP)+/Tg] at 5 dpf. Bright-field (A) and EGFP (B) images are shown. Scale bar: 500 µm. (C) qPCR analysis for the EGFP-P2A-krasG12D transgene in the sibling controls and tumor-bearing larvae. The scores are normalized to expression of rpl13a. The data harbors three biological replicates. Error bars represent means±s.e.m. (D-I) Representative images of DAPI staining for transversal sections of the posterior intestine of tumor-bearing larvae and the sibling controls at 5 dpf. DAPI (D,E) and EGFP (F,G) images are shown. In the merged images (H,I), DAPI and EGFP signals are shown in blue and green, respectively. Scale bar: 100 µm. (J) The number of EGFP- and DAPI-positive intestinal cells. The number of nuclei was manually counted from a single section per individual larva. The data harbors 7 and 11 biological replicates from tumor-bearing larvae and the sibling controls, respectively. Error bars represent means±s.e.m. Statistical significance was tested using Student's t-test (unpaired, one-tailed). (K-R) Representative images of fluorescent immunohistochemistry for phosphorylated histone H3 (pH3) in transversal sections of the posterior intestine of tumor-bearing larvae and the sibling controls at 5 dpf. pH3 (K,L), DAPI (M,N) and EGFP (O,P) images are shown. White arrow indicates intestinal cells positive for pH3, EGFP and DAPI. In the merged images (Q,R), pH3, DAPI and EGFP signals are shown in red, blue and green, respectively. Scale bar: 100 µm. (S) The number of intestinal cells positive for pH3, EGFP and DAPI. The number of pH3-, EGFP- and DAPI-positive cells was counted from a single section per individual larva. The data harbors 8 and 6 biological replicates from tumor-bearing larvae and the sibling controls, respectively. Error bars represent means±s.e.m. Data are representative of at least two independent experiments. |
| Fish: | |
|---|---|
| Observed In: | |
| Stage: | Day 5 |