
|
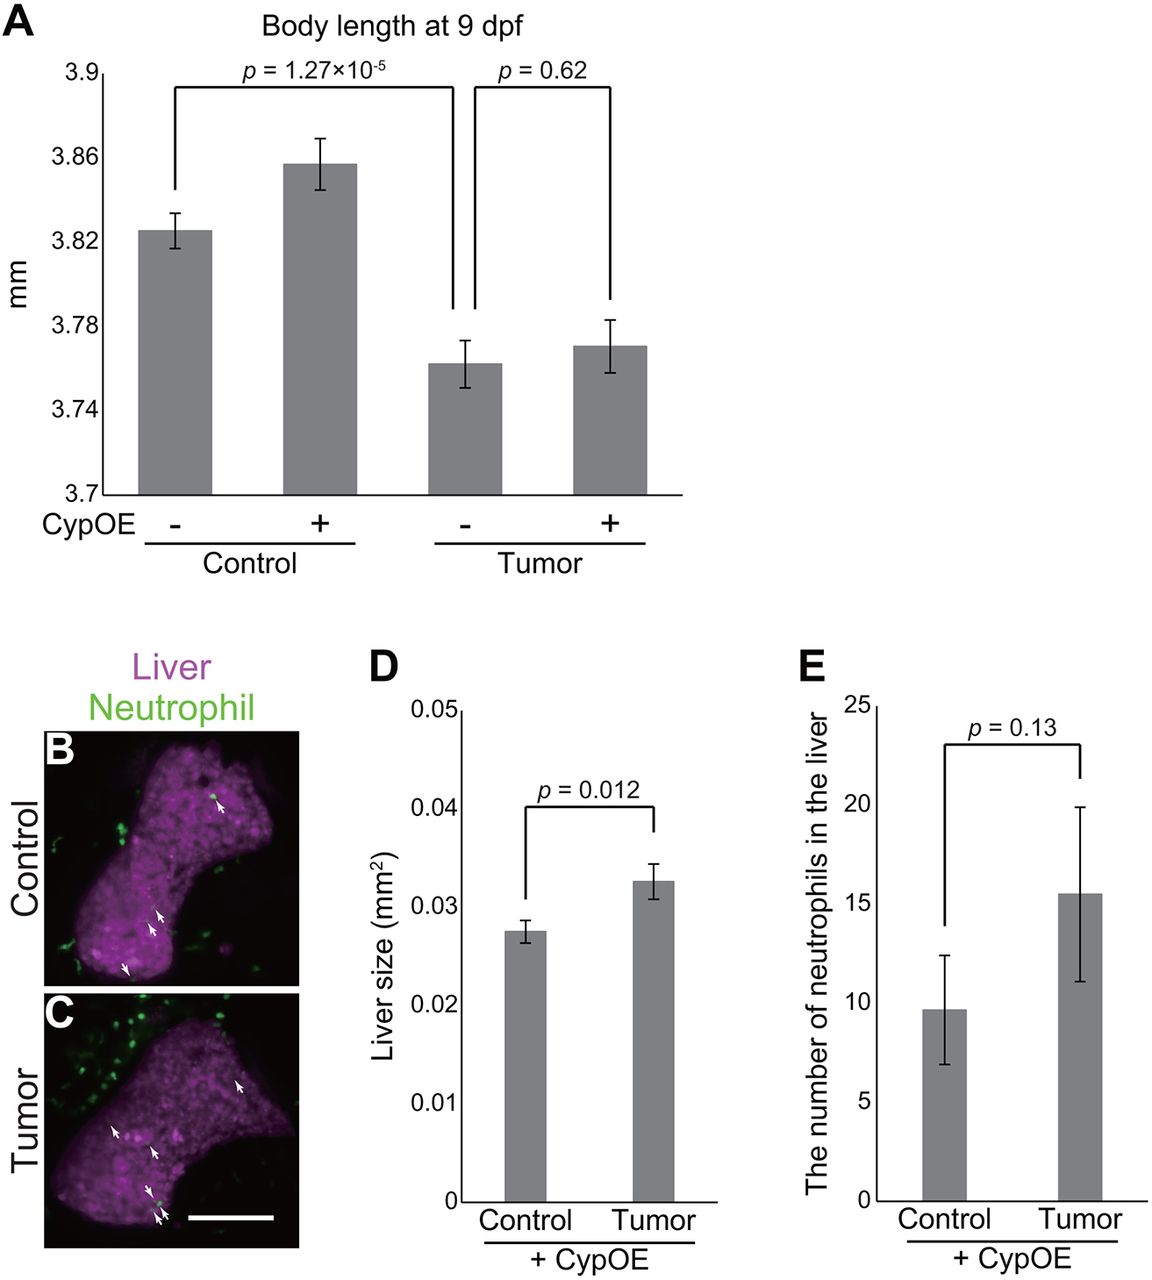
Fig. 8
Overexpression of cyp7a1 in the liver ameliorates tumor-induced liver inflammation. (A) Body length data of the sibling controls and tumor-bearing larvae at 9 dpf in the Tg(fabp10a:mCherry-P2A-cyp7a1) background. The number of larvae used is 79 (control larvae), 73 [control larvae with Tg(fabp10a:mCherry-P2A-cyp7a1)], 81 (tumor-bearing larvae) and 74 [tumor-bearing larvae with Tg(fabp10a:mCherry-P2A-cyp7a1)]. Error bars represent means±s.e.m. Statistical significance was tested using Student's t-test (unpaired, two-tailed). CypOE − and + indicate the absence and presence of Tg(fabp10a:mCherry-P2A-cyp7a1), respectively. (B,C) Representative images of the livers of the sibling controls and tumor-bearing larvae carrying Tg(lyz:EGFP) and Tg(fabp10a:mCherry-P2A-cyp7a1) at 7 dpf. Neutrophils and the liver are shown by green and magenta, respectively. Scale bar: 100 µm. White arrows indicate representative neutrophils. (D) Liver size and (E) the number of neutrophils of the sibling controls and tumor-bearing larvae carrying Tg(lyz:EGFP) and Tg(fabp10a:mCherry-P2A-cyp7a1) at 7 dpf. Liver size was measured from Tg(fabp10a:mCherry-P2A-cyp7a1) images using ImageJ software. The data harbors 18 biological replicates (pooled from two independent experiments). Error bars represent means±s.e.m. Statistical significance was tested using Student's t-test (unpaired, one-tailed). Data are representative of at least two independent experiments, except D,E.