
|
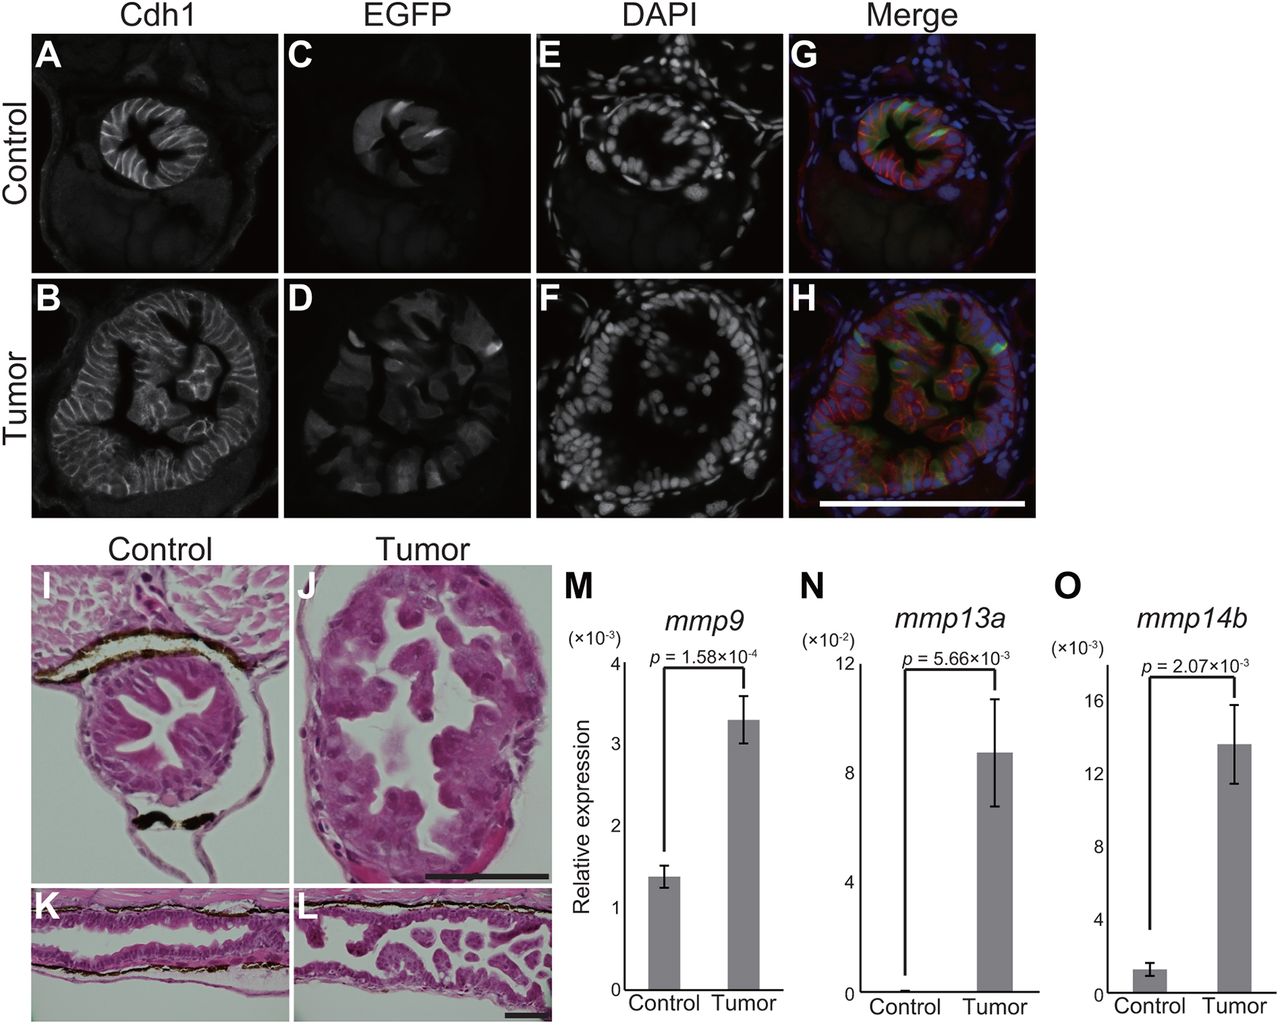
Fig. 3
pInt-Gal4 driven krasG12D expression results in intestinal epithelial tumor. (A-H) Representative images of fluorescent immunohistochemistry for Cdh1 in transversal sections of the posterior intestine of the sibling controls and tumor-bearing larvae at 5 dpf. Cdh1 (A,B), EGFP (C,D) and DAPI (E,F) images are shown. In the merged images (G,H), Cdh1, EGFP and DAPI signals are shown in red, green and blue, respectively. Scale bar: 100 µm. (I-L) Representative images of HE-stained intestinal sections of the sibling controls (I,K) and tumor-bearing larvae (J,L) at 5 dpf. Transversal and sagittal sections are shown in I,J and K,L, respectively. Scale bars: 50 µm. (M-O) qPCR analysis for mmp genes in the intestine at 9 dpf. The scores are normalized to expression of rpl13a. The data harbors 5 biological replicates, each containing the intestines from 5 larvae. Error bars represent means±s.e.m. Statistical significance was tested using Student's t-test (unpaired, one-tailed). Data are representative of at least two independent experiments.