
|
Fig. S2
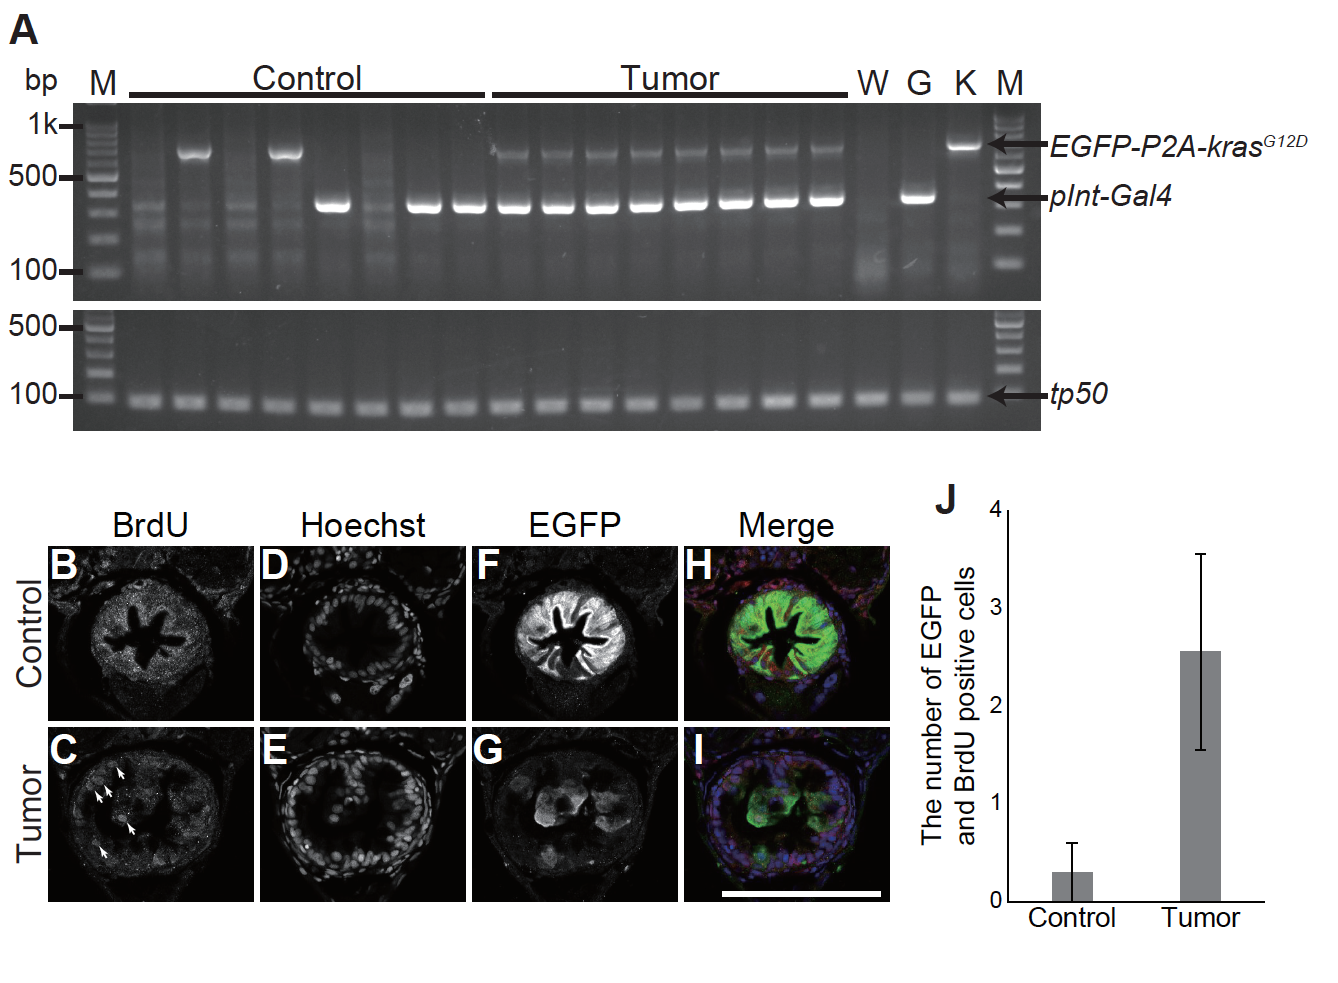
Characterization of the pInt-Gal4-driven tumor model
(A) A gel image of genotyping of tumor-bearing larvae. Band sizes detecting Tg(5xUAS:EGFP-P2A-krasG12D), Tg(pInt-Gal4) and tp53 are 701 bp, 345 bp and 88 bp, respectively. tp53 locus is used as a PCR control. M, DNA ladder marker: W, wild type larvae: G, parental Tg(pInt-Gal4) line: K, parental Tg(5xUAS:EGFP-P2A-krasG12D) line. (B)-(I) Representative images of fluorescent immunohistochemistry for BrdU and EGFP in transversal sections of the posterior intestine of the sibling controls and tumor bearing larvae at 5 dpf. BrdU (B, C), Hoechst33342 (D, E) and EGFP (F, G) images are shown. In the merged images (H, I), BrdU, Hoechst33342 and EGFP signals are shown in red, blue and green, respectively. White arrows indicate intestinal cells positive for BrdU, Hoechst33342, and EGFP. Scale bar indicates 100 m. (J) The number of BrdU and EGFP positive intestinal cells. The number of BrdU and EGFP positive cells was counted from single section per individual larva. The data harbors 10 and 9 biological replicates from the sibling controls and tumor-bearing larvae, respectively. Error bars represent s.e.m.