
Fig. 6
|
Fig. 6
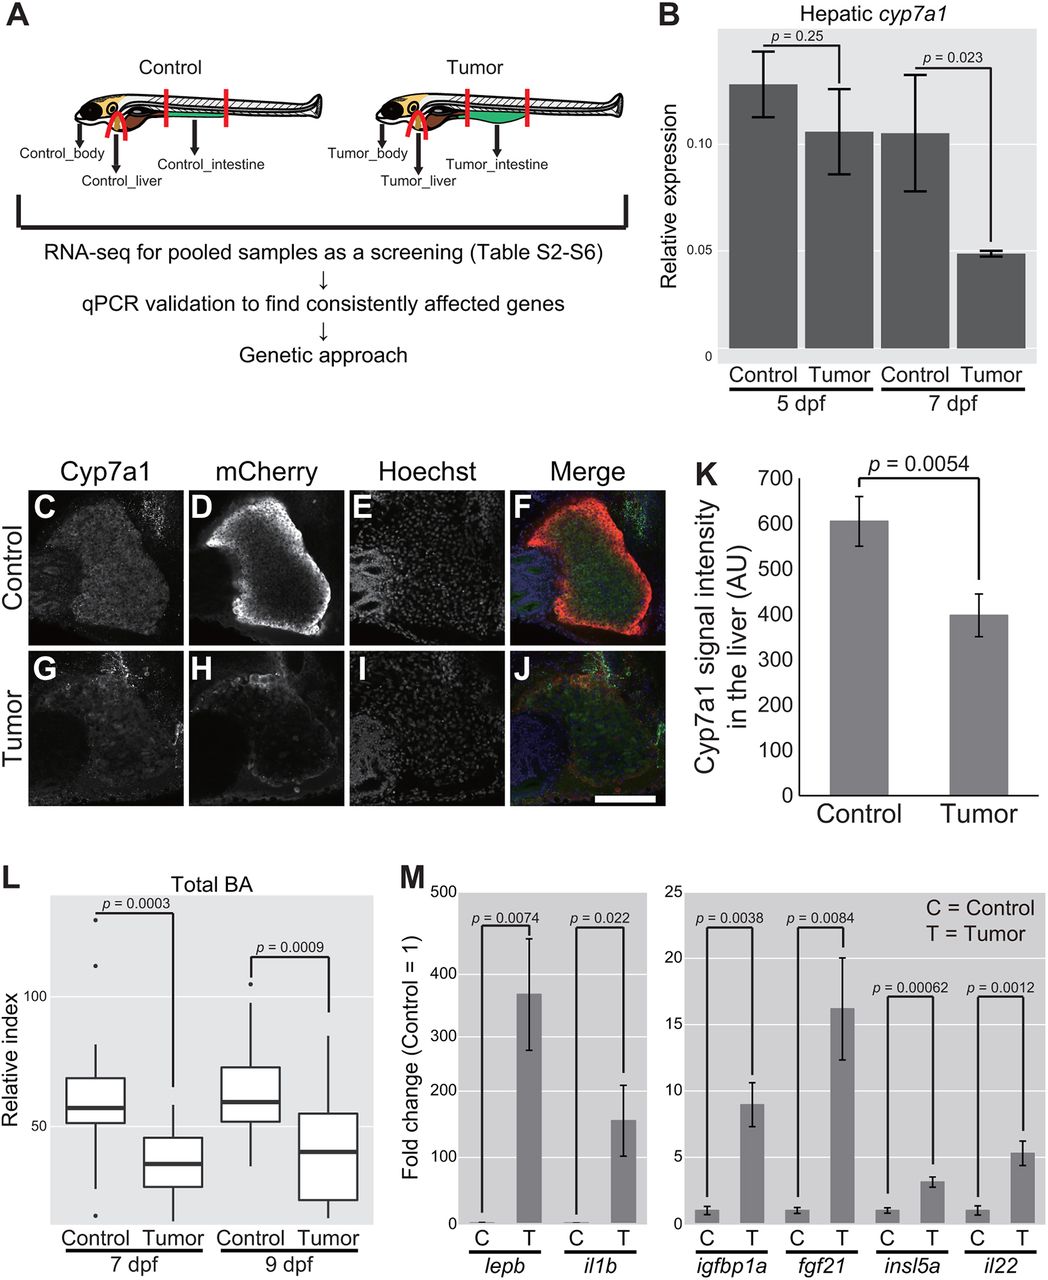
Whole-organism gene expression analysis identifies tumor–liver crosstalk characterized by hepatic cyp7a1 and total BA. (A) Schematic representation of zebrafish dissection in our RNA-seq experiments followed by qPCR validation and genetic approaches. (B) Expression of cyp7a1 in the liver. The scores are normalized to expression of rpl13a. The data harbors 3 biological replicates, each containing 7 larvae for 5 dpf and 5 larvae for 7 dpf, respectively. Error bars represent means±s.e.m. Statistical significance was tested using Student's t-test (unpaired, one-tailed). (C-J) Representative images of whole-mount fluorescent immunohistochemistry for Cyp7a1 in the livers of the sibling controls and tumor-bearing larvae carrying Tg(fabp10a:mCherry) at 7 dpf. Cyp7a1 (C,G), mCherry (D,H) and Hoechst 33342 (E,I) images are shown. In the merged images (F,J), Cyp7a1, mCherry and Hoechst signals are shown in green, red and blue, respectively. Scale bar: 100 µm. (K) The averages for Cyp7a1 signal intensity in the liver of the sibling controls and tumor-bearing larvae at 7 dpf are shown. The number of larvae used is 14 and 11 for the sibling controls and tumor-bearing larvae, respectively (one independent experiment). Error bars represent means±s.e.m. Statistical significance was tested using Student's t-test (unpaired, one-tailed). (L) Measurement for systemic BA levels at 7 and 9 dpf. The number of larvae used is 19 (7 dpf control larvae), 19 (7 dpf tumor-bearing larvae), 22 (9 dpf control larvae) and 18 (9 dpf tumor-bearing larvae). The scores are relative index determined using bile acids as standards (see Materials and Methods). Statistical significance was tested using Student's t-test (unpaired, one-tailed). (M) Expression of a set of secreted protein-coding genes in the intestinal tumor and normal intestine. The scores are normalized to expression of rpl13a and to the sibling controls (=1). The data harbors 5 biological replicates, each containing 5 larvae. Error bars represent means±s.e.m. Data are representative of at least two independent experiments, except C-K.