
- Title
-
Vsx2 in the zebrafish retina: restricted lineages through derepression
- Authors
- Vitorino, M., Jusuf, P.R., Maurus, D., Yukiko, Y., Higashijima, S.I., and Harris, W.A.
- Source
- Full text @ Neural Dev.
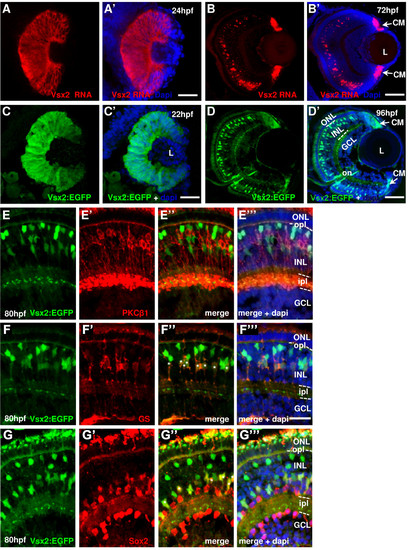
Vsx2 expression in the zebrafish retina. (A-G) Cryosections through the central retina of zebrafish embryos counterstained with DAPI (blue). Developmental stages are indicated by hours post-fertilization (hpf) at 28.5°C. (A, B) vsx2 in situ hybridization at 24 hpf (A) and 72 hpf (B). (C, D) Tg(vsx2:GFP) shows green fluorescent protein (GFP) expression in retinal progenitor cells (C) and in cells of the outer part of the INL (D). Arrows indicate vsx2 RNA (B) and Vsx2:GFP (D) expression in the ciliary margin (CM). (E-G) Tg(vsx2:GFP) expressing retinas labelled with the bipolar cell marker protein kinase C (PKC) at 80 hpf (E) and the two Müller cell markers glutamine synthetase (GS) (F) and Sox2 (G). No Vsx2:GFP-positive cells co-localise with the bipolar marker at 80 hpf (E). Müller cells expressing GS and Sox2 are also Vsx2:GFP-positive ((F″, G″) asterisks). GCL, ganglion cell layer; INL, inner nuclear layer; ipl, inner plexiform layer; L, lens; ONL, outer nuclear layer; opl, outer plexiform layer. Scale bars: (A-D) 100 μm; (E-G) 40 μm. EXPRESSION / LABELING:
|
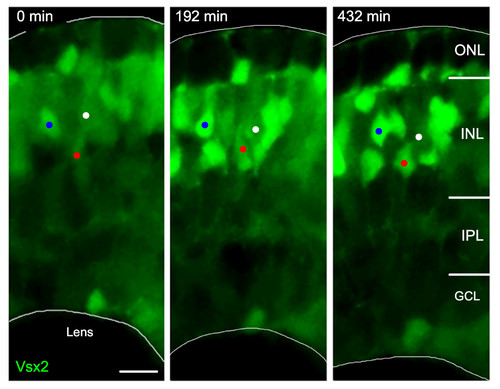
Vsx2:GFP up- and downregulation. Time-lapse images from Additional file 1 of a developing Tg(vsx2:GFP) retina. As development progresses, some cells (one example marked by a white dot) reduce their Vsx2:GFP expression, whereas other cells (two examples marked by blue and red dots) increase the expression of GFP and differentiate as bipolar cells with processes in the IPL. GCL, ganglion cell layer; INL, inner nuclear layer; IPL, inner plexiform layer; ONL, outer nuclear layer. Scale bar: 10 μm. |
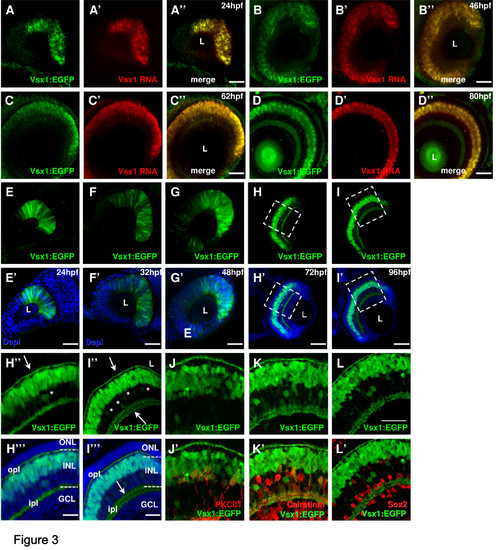
Vsx1 expression in the zebrafish retina. (A-D)vsx1 in situ hybridization in 24 hours post-fertilization (hpf) (A), 46 hpf (B), 62 hpf (C) and 80 hpf (D) Tg(vsx1:GFP) transgenic embryos shows complete co-localisation of vsx1 RNA and Vsx1 driven GFP expression. (E-I)Whole-mount lateral view of the Tg(vsx1:GFP) retina of zebrafish embryos counterstained with DAPI (blue) reveals expression of green fluorescent protein (GFP) in a subpopulation of retinal progenitor cells from 24 to 48 hpf as well as differentiated neurons at 72 and 96 hpf. (H-L)Cryosections through the central retina of Tg(vsx1:GFP) reveal GFP expression in cell bodies in the outer INL and processes in the OPL and IPL (arrows). GFP is also expressed in a few cells in the inner half of the INL (some indicated by asterisks). (J-L) Tg(vsx1:GFP) retinas at 80 hpf labelled with protein kinase C (PKC)β1 (J), calretinin (K) and Sox2 (L). Vsx1:GFP cells co-label with PKC-positive bipolar cells and calretinin-positive amacrine cells, but not with Sox2-labelled Müller cells. GCL, ganglion cell layer; INL, inner nuclear layer; ipl, inner plexiform layer; L, lens; ONL, outer nuclear layer; opl, outer plexiform layer. Scale bars: (A-I) 100 μm; (J-L) 40 μm. |
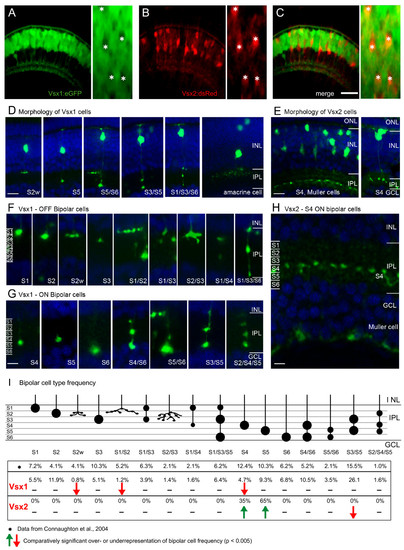
Vsx1 and Vsx2 are expressed in the distinct subtypes of bipolar cells. (A-C) Red and green fluorescence images from Tg(vsx1:GFP;vsx2:dsRed) double transgenic embryos, showing that they are expressed in separate populations of cells in the outer INL. Vsx2:dsRed positive neurons are Vsx1:GFP negative (asterisks) (D-H)Confocal images showing the morphology of individual Vsx1:GFP (D, F, G) and Vsx2:GFP (E, H) cells. Counterstained with DAPI (blue). Morphology of entire Vsx1 (D) and Vsx2 (E) expressing cells reveals bipolar cells are labelled. (F-G) Higher magnification of the IPL reveals different subtypes identified by their axon terminal stratification depth and pattern. Vsx1:GFP is expressed in many types of OFF bipolar (F) and ON bipolar (G) subtypes, which stratify throughout the entire IPL. In contrast, Vsx2:GFP is expressed in only one type of bipolar cell stratifying in stratum 4 (E, H) and in Müller cells, whose endfeet can be seen in the GCL. (I)Schematic showing the axon terminals and frequency of occurrence of Vsx1:GFP and Vsx2:GFP bipolar subtypes together with the previously described frequency from diOlistic labelling [29]. Three types of Vsx1:GFP cells occur at a statistically lower frequency than described previously and may be underrepresented in the Vsx1:GFP-labelled population (red arrows). The two types of Vsx2:GFP cells (S4 and S5), occur at a statistically higher frequency in the Vsx2:GFP population than the diOlystic population (green arrows). GCL, ganglion cell layer; INL, inner nuclear layer; IPL, inner plexiform layer; ONL, outer nuclear layer. For quantification of subtypes, IPL was subdivided into six equal strata (S1–S6). Scale bars: (A-C) 40 μm; (D, E) 10 μm; (F-H) 5 μm. EXPRESSION / LABELING:
|
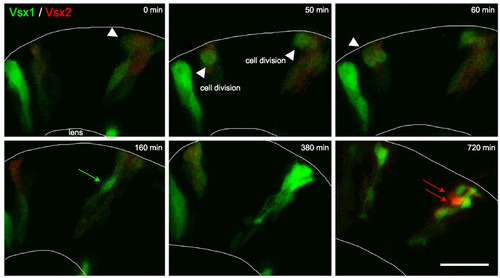
Vsx2 versus Vsx1 arise from distinct lineages. Time-lapse images from Additional file 2 showing cells transplanted from Tg(vsx1:GFP; vsx2:dsRed) into wild type to reveal individual cell morphology. Vsx1:GFP progenitors that have already lost Vsx2:DsRed (green only) or are in the process of (weak red signal remaining in these green cells) downregulating Vsx2:DsRed divide apically (white arrowheads). They upregulate Vsx1:GFP (green arrows) and differentiate as a group of bipolar cells. Vsx2:DsRed is expressed at a low level initially. It fades in cells that turn on Vsx1:GFP, but the red signal also fades during the movie shown in Additional file 2 due to bleaching, so Vsx2:DsRed progenitors cannot be followed throughout the entire movie. Vsx2:DsRed is later dramatically upregulated in cells that do not express Vsx1 (red arrows). Scale bar: 20 μm. |
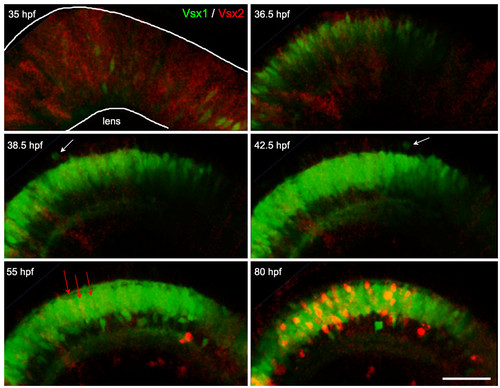
Vsx2/Vsx1 down-/upregulation, followed by Vsx2 upregulation. Time-lapse images from Additional file 3 of a double transgenic Tg(vsx1:GFP; vsx2:dsRed) embryo. Vsx2 is initially expressed in the majority of progenitors in the developing neuroepithelium and becomes downregulated in cells that upregulate Vsx1. These cells continue to undergo cell divisions at the apical surface (white arrows) and start differentiating around 40 hours post-fertilization (hpf). Later (around 55 hpf), a subpopulation of cells starts upregulating the expression of Vsx2:DsRed (red arrows) and then differentiates in the inner nuclear layer. Scale bar: 500 μm. EXPRESSION / LABELING:
|
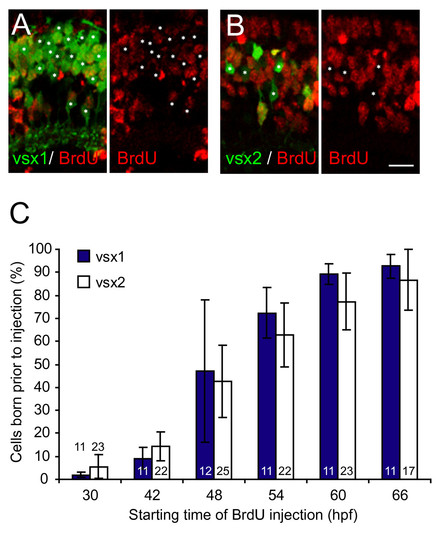
Vsx1 and Vsx2 bipolar subtypes are born at the same time. Quantification of cumulative bipolar birthdates in bromodeoxyuridine (BrdU)-injected Tg(vsx1:GFP) and Tg(vsx2:GFP) retinas. (A, B) Micrographs of central sections of retina through 75 hours post-fertilization (hpf) transgenic zebrafish showing Vsx1:GFP (A) or Vsx2:GFP (B) expression and BrdU immunohistochemistry. Prior to BrdU injection at 42 hpf, about a third of Vsx1:GFP- and Vsx2:GFP-positive cells in this central region of the retina underwent terminal division and are, therefore, BrdU immunonegative (asterisks). (C) Percentage of GFP-positive cells from Tg(vsx1:GFP) or Tg(vsx2:GFP) at 75 hpf that were born prior to the onset of BrdU injections. The temporal birth pattern of Vsx1:GFP cells and Vsx2:GFP cells is the same. Most of the vsx1 and vsx2 GFP-positive cells are born between 42 and 60 hpf. Numbers in bars indicate number of sections analysed. For Vsx1:GFP, the total number of cells included for each time point ranged from 1,209 to 1,864; for Vsx2:GFP, the total number of cells included ranged from 820 to 1,226. Note that the measurements in this graph include the entire retina (that is the central retina shown in (A, B) and the more peripheral regions where cells are born later), leading to a lower percentage in the graph than shown in the micrographs in (A, B), which are taken of the central section. Error bars show standard deviations. Scale bar: 10 μm. |
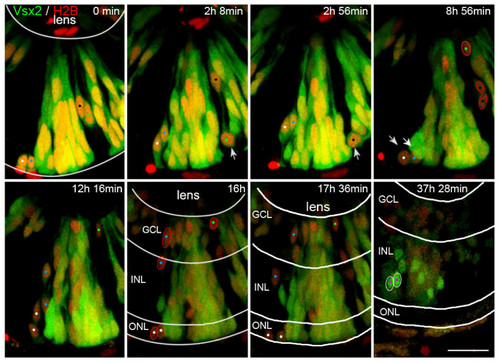
Some Vsx2 progenitors lose Vsx2 expression and differentiate as presumed photoreceptors, amacrine cells and ganglion cells. Time-lapse images of Additional file 4, showing transplanted cells from a transgenic Tg(vsx2:GFP) embryo that was injected with H2B:RFP RNA to mark all cells transplanted. Initially, all transplanted progenitor cells express Vsx2. Some cells (white arrows) undergo cell division and downregulate Vsx2:GFP expression (marked by white arrows at mitosis and white, blue, green and black spots). The Vsx2-negative daughter cells of these divisions (red outlines) end up in the ONL (presumed photoreceptors), inner INL (presumed amacrine cells) and GCL (presumed ganglion cells). In contrast, cells that upregulate the Vsx2:GFP expression late during development become restricted to the INL only, where they differentiate into Vsx2-positive bipolar or Müller cells (purple dots, white outlines). GCL, ganglion cell layer; INL, inner nuclear layer; ONL, outer nuclear layer. Scale bar: 20 μm. |
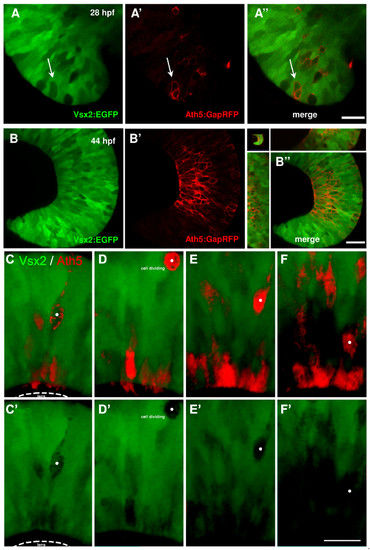
Ath5 progenitor cells arise from Vsx2 progenitors that lose Vsx2:GFP expression. (A, B) Images of live double transgenic Tg(vsx2:GFP/ath5:GapRFP) whole-mount retinas at different time points of retina development indicated as hours post-fertilisation (hpf). (A) At 28 hpf, a few cells in the retina no longer express green fluorescent protein (GFP) driven by vsx2. Some (white arrows), but not all of these Vsx2:GFP-negative cells express Ath5:RFP. (A′-B′) As development progresses, the number of cells that express Ath5:RFP increase as the number of Vsx2:GFP cells diminishes. Ath5-expressing, Vsx2:GFP-negative cells divide apically and many of the differentiating cells can be seen to settle in the developing ganglion cell layer, which becomes devoid of Vsx2:GFP cells. Images are from the movie in Additional data file 5. (C-F) Double label from a Tg(ath5:RFP;vsx2:GFP) retina in which an Ath5:RFP progenitor divides once to produce one daughter that differentiates as an RGC. (E′-F′) Vsx2 expression can be seen to be downregulated in this Ath5:RFP progenitor (whose soma is marked by the white dot). Scale bars: (A) 16 μm; (B) 27 μm; (C-F) 20 μm. |
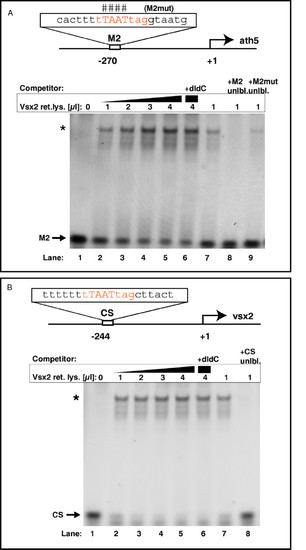
Vsx2 binds to ath5 and vsx2 promoter sequences in vitro. (A)In vitro translated Vsx2 protein was incubated with a Cy5-end-labeled probe against the ath5 promoter fragment (M2) with or without competitors. The binding sequence core of M2 is shown in red. Lanes 2–5: addition of increasing amounts of Vsx2 protein shifts cumulative amounts of M2 oligo (asterisk; band shift). In vitro translated luciferase protein served as negative control and induced no band shift (lane 1). Addition of the unspecific competitor poly(dI-dC) (lane 6) did not reduce binding. Lanes 7–9: band shift of labelled M2 oligo by Vsx2 was challenged by adding specific competitors. Addition of excess unlabeled M2 oligo led to out-competition of the labelled M2 oligo (lane 8 versus lane 7). Addition of excess unlabeled mutated M2 oligo could compete only weakly with binding (lane 9). The bases mutated in this oligo are indicated by the hash symbols above the binding sequence core. (B) In vitro translated Vsx2 protein was incubated with a Cy5-end-labeled probe against the vsx2 promoter fragment (CS) with or without competitors. The binding sequence core of CS is shown in red. Lanes 2–5: addition of increasing amounts of Vsx2 protein shifts cumulative amounts of CS oligo (asterisk; band shift). In vitro translated luciferase protein served as negative control and induced no band shift (lane 1). Addition of the unspecific competitor poly(dI-dC) (lane 6) did not reduce binding significantly. Lanes 7–8: addition of excess unlabeled CS oligo led to out-competition of the labelled CS oligo. |
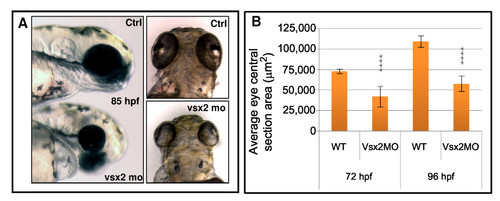
Vsx2 depletion leads to microphthalmia in zebrafish. (A) Lateral and dorsal views of representative 85 hours post-fertilization (hpf) control (Ctrl) and Vsx2 morphant (mo) embryos. Vsx2 morphants are microphthalmic. (B) Graph showing the area of central retina sections of control (wild type (WT)) and Vsx2 morphant (Vsx2MO) at 72 hpf and 96 hpf; 10–20 sections from different eyes were analysed. Vsx2 morphant retinas show a significant (asterisks) reduction in eye area (p < 0.0001). Error bars indicate Standard Error of the Mean. PHENOTYPE:
|
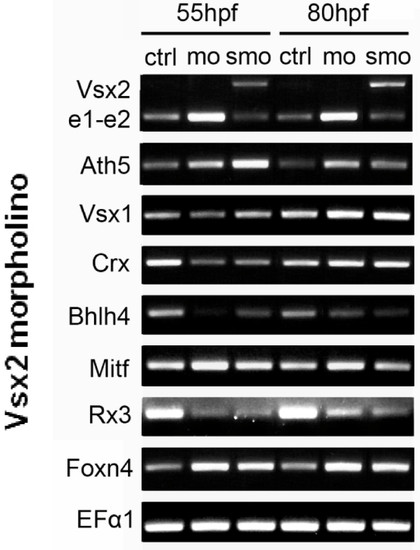
Transcription factors that are upregulated and downregulated in Vsx2 morphants. RT-PCR of control (Ctrl) and Vsx2 morphant embryos showing changes in gene expression. mRNAs for Vsx2, Ath5, Mitf, and Foxn4 are all upregulated in Vsx2 morphants, suggesting that these transcription factors are normally repressed by Vsx2. On the other hand, Crx, Bhlh4 and Rx3 are downregulated in Vsx2 morphants, suggesting that these genes are indirectly positively controlled by Vsx2. Vsx1 levels seem to be unchanged in Vsx2 morphants. Vsx2e1-e2 (the PCR product of primers that amplify the Vsx2 region from exon 1 to exon 2) is also upregulated when Vsx2 is knocked down with the translational morpholino (mo), whilst efficiency of the splicing morpholinos (smo) can be seen by the increased PCR product size due to splicing being prevented by the morpholino. The housekeeping gene encoding EF1α (Elongation factor 1α) was used as a loading control. EXPRESSION / LABELING:
|
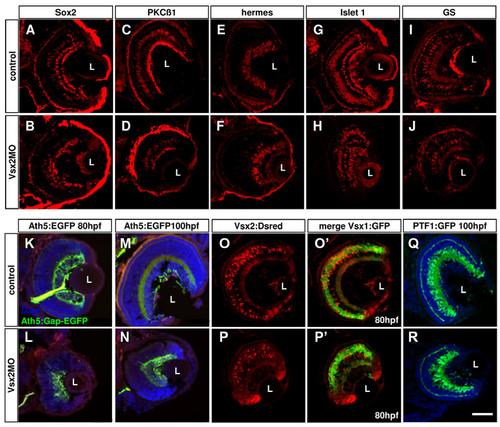
Loss of Vsx2 allows various cell types to develop in the retina. (A-J) Cryosections of 80 hours post-fertilization (hpf) retinas labelled with different cell-specific markers show that Vsx2 morphant retinas have all cell types present: Sox2 labels amacrine and Müller cells (A, B); protein kinase C (PKC)β1 labels some bipolar cells (C, D); Hermes labels ganglion cells (E, F); Islet 1 labels horizontal, bipolar, some amacrine and ganglion cells (G, H); glutamine synthetase (GS) labels Müller cells (I, J). (K-T)Cryostat sections of 80 hpf transgenic retinas similarly reveal presence of all marked cell types in Vsx2 morphants. (K-N) Vsx2 morphant Tg(ath5:Gap-GFP) retinas (double labelled with the ganglion cell marker Zn5 in red) still have green fluorescent protein (GFP)- and Zn5-labelled ganglion cells and form an optic nerve to the tectum. (O-R) Vsx2 morphant double transgenic Tg(vsx1:GFP-vsx2:dsRed) have both GFP- and DsRed-labelled cells, but appear to have comparatively fewer Vsx2:DsRed cells. As in the control transgenics, Vsx1:GFP and Vsx2:DsRed do not co-localise in the same cells. (S, T) Vsx2 morphant Tg(ptf1a:GFP) retinas show GFP labelling for horizontal and amacrine similar to that in controls, although some GFP cells are displaced and can be found closer to the lens in the GCL of the morphant retinas. L, lens. Scale bar: (A-T) 47 μm. EXPRESSION / LABELING:
PHENOTYPE:
|
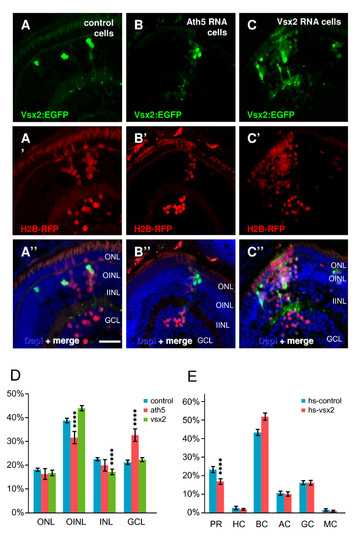
Transplantation of wild type, Ath5, and Vsx2 overexpressing cells in wild-type embryos. (A-C)Tg(vsx2:GFP) transplanted into wild-type embryos after injection with H2B-RFP RNA (to mark all transplanted cells) and various constructs for overexpression. (A) Green-fluorescent protein (GFP)-expressing cells from control Tg(vsx2:GFP) become bipolar and Müller cells, whilst all (H2B-RFP-positive) cells become all kinds of cells in the expected frequency. (B) When co-injecting H2B-RFP RNA with ath5, the ganglion cell fate is promoted (more H2B-RFP cells in the GCL), but Vsx2:GFP cells still become bipolar and Müller cells. (C) Co-injection of H2B-RFP RNA with vsx2 promotes bipolar cell fate, seen by (D) a highly significant (p < 0.001) increase of H2B-RFP in the INL bipolar layer at the expense of amacrine cells (asterisks). (E) Overexpression using a heatshock vsx2 construct similarly results in an increased frequency of bipolar cells, this time at the expense of photoreceptors. Error bars indicate Standard Error of the Mean. AC, amacrine cell; BC, bipolar cell; GCL, ganglion cell layer; H, horizontal cell; hs, heat shock; IINL, inner half of inner nuclear layer; MC, Müller cell; OINL, outer half of inner nuclear layer; ONL, outer nuclear layer; PH, photoreceptor; RGC, retinal ganglion cell. Scale bar (A-C) 25 μm. |