
|
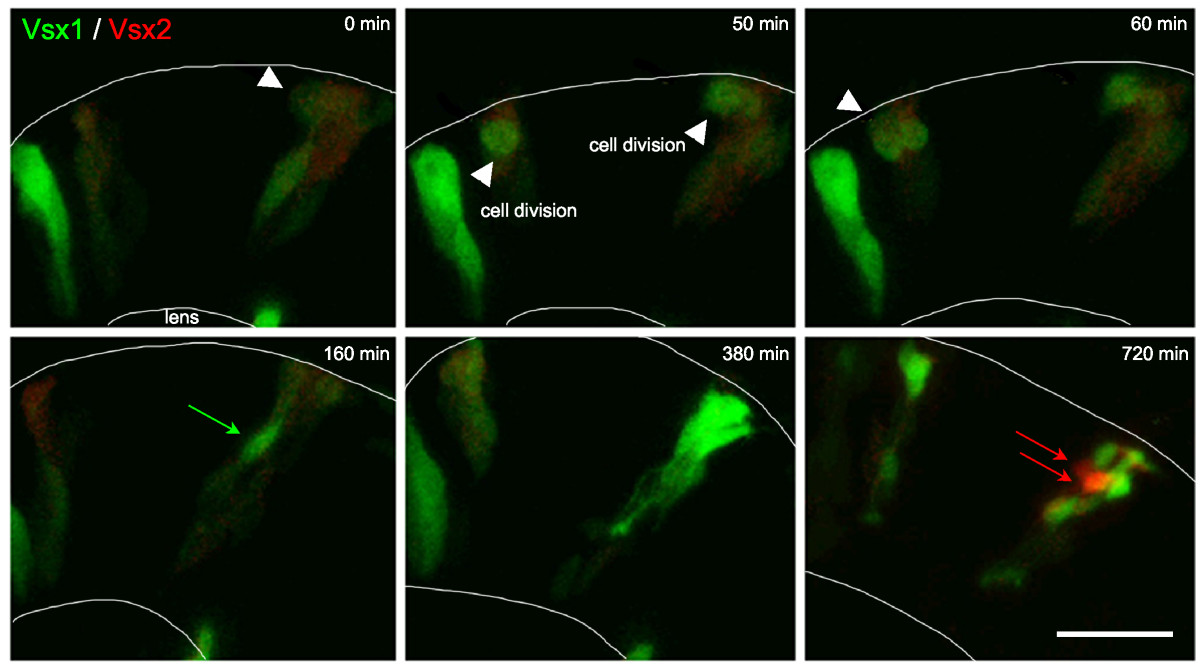
Fig. 5 Vsx2 versus Vsx1 arise from distinct lineages. Time-lapse images from Additional file 2 showing cells transplanted from Tg(vsx1:GFP; vsx2:dsRed) into wild type to reveal individual cell morphology. Vsx1:GFP progenitors that have already lost Vsx2:DsRed (green only) or are in the process of (weak red signal remaining in these green cells) downregulating Vsx2:DsRed divide apically (white arrowheads). They upregulate Vsx1:GFP (green arrows) and differentiate as a group of bipolar cells. Vsx2:DsRed is expressed at a low level initially. It fades in cells that turn on Vsx1:GFP, but the red signal also fades during the movie shown in Additional file 2 due to bleaching, so Vsx2:DsRed progenitors cannot be followed throughout the entire movie. Vsx2:DsRed is later dramatically upregulated in cells that do not express Vsx1 (red arrows). Scale bar: 20 μm.