
Image
|
Figure Caption
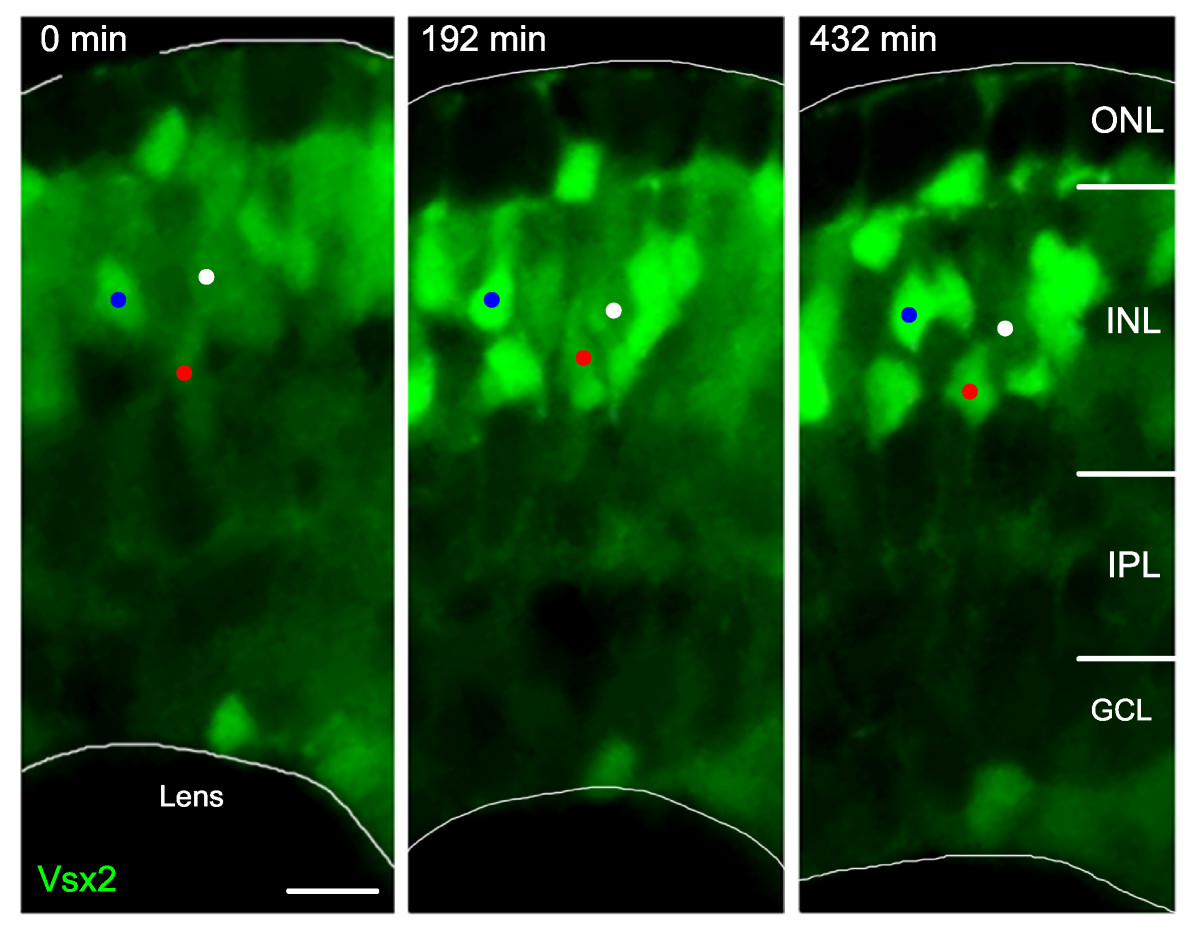
Fig. 2 Vsx2:GFP up- and downregulation. Time-lapse images from Additional file 1 of a developing Tg(vsx2:GFP) retina. As development progresses, some cells (one example marked by a white dot) reduce their Vsx2:GFP expression, whereas other cells (two examples marked by blue and red dots) increase the expression of GFP and differentiate as bipolar cells with processes in the IPL. GCL, ganglion cell layer; INL, inner nuclear layer; IPL, inner plexiform layer; ONL, outer nuclear layer. Scale bar: 10 μm.
Acknowledgments
This image is the copyrighted work of the attributed author or publisher, and
ZFIN has permission only to display this image to its users.
Additional permissions should be obtained from the applicable author or publisher of the image.
Full text @ Neural Dev.