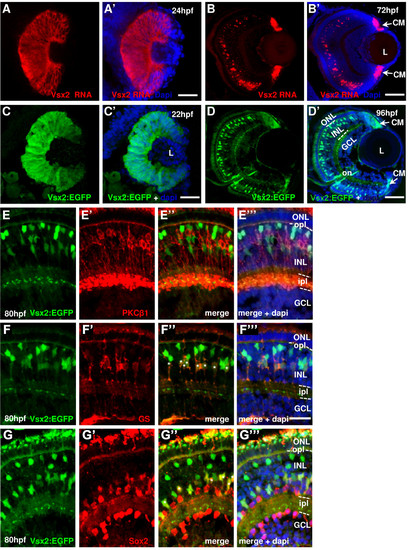
Vsx2 expression in the zebrafish retina. (A-G) Cryosections through the central retina of zebrafish embryos counterstained with DAPI (blue). Developmental stages are indicated by hours post-fertilization (hpf) at 28.5°C. (A, B) vsx2 in situ hybridization at 24 hpf (A) and 72 hpf (B). (C, D) Tg(vsx2:GFP) shows green fluorescent protein (GFP) expression in retinal progenitor cells (C) and in cells of the outer part of the INL (D). Arrows indicate vsx2 RNA (B) and Vsx2:GFP (D) expression in the ciliary margin (CM). (E-G) Tg(vsx2:GFP) expressing retinas labelled with the bipolar cell marker protein kinase C (PKC) at 80 hpf (E) and the two Müller cell markers glutamine synthetase (GS) (F) and Sox2 (G). No Vsx2:GFP-positive cells co-localise with the bipolar marker at 80 hpf (E). Müller cells expressing GS and Sox2 are also Vsx2:GFP-positive ((F″, G″) asterisks). GCL, ganglion cell layer; INL, inner nuclear layer; ipl, inner plexiform layer; L, lens; ONL, outer nuclear layer; opl, outer plexiform layer. Scale bars: (A-D) 100 μm; (E-G) 40 μm.
|
