FIGURE SUMMARY
Title

Conserved glucokinase regulation in zebrafish confirms therapeutic utility for pharmacologic modulation in diabetes

Authors
Schmitner, N., Thumer, S., Regele, D., Mayer, E., Bergerweiss, I., Helker, C., Stainier, D.Y.R., Meyer, D., Kimmel, R.A.
Source
Full text @ Commun Biol

Gck isoforms and their expression in the zebrafish.

a Genomic structure of the zebrafish gck gene and the three transcript isoforms. Exons are indicated by black rectangles and introns by lines, curved arrows represent the sites of transcription initiation. b Quantification of overall gck RNA counts from sorted adult zebrafish pancreatic cells (N = 3 biological replicates)28 and embryonic hepatocytes (N = 2 biological replicates for each time point)29. Plot shows Min to Max. c Heat map showing gck isoform expression in sorted zebrafish pancreatic α-, β- and δ-cells and embryonic hepatocytes at 4–6 dpf using the same published datasets28,29 and the improved zebrafish transcriptome annotation of Lawson et al.26.

EXPRESSION / LABELING:
Gene:
Fish:
Anatomical Terms:
Stage Range: Day 4 to Adult

Gck shows nutrient dependent expression in the liver and constitutive expression in the endocrine islet at different developmental stages.

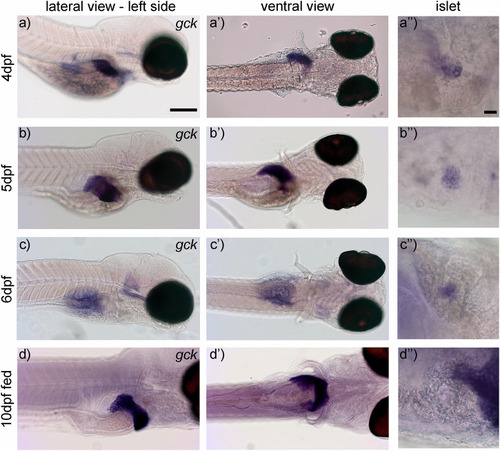
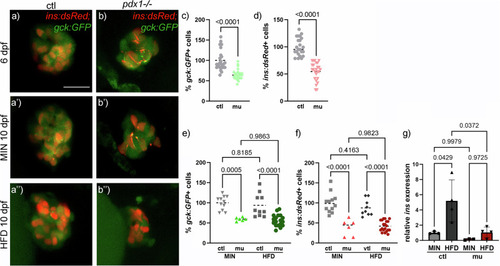
Whole mount in situ hybridization at 4 dpf shows gck expression in the developing liver as shown in lateral and ventral view (a and a’) and in the endocrine islet (a”). Expression at 5 dpf expands with the development of the liver (b and b’) and is constitutive in the islet (b”). At 6 dpf expression in the liver is almost undetectable (c and c’), while expression in the islet is visible (c”). Expression is prominent in fed 10 dpf larvae in the liver (d and d’). Expression in the islet in fed 10 dpf larvae is not detectable (d”), which is likely due to limited penetration of the RNA-probe. Scale bar: 100 µm and 20 µm.

EXPRESSION / LABELING:
Gene:
Fish:
Condition:
Anatomical Terms:
Stage Range: Day 4 to Days 7-13

Gck:GFP indicates gck expression in islet cells.

a Most β-cells express gck:GFP (solid arrows) as observed in 5 dpf double transgenic gck:GFP;ins:dsRed larvae. b Immunohistochemistry reveals gck:GFP expression in all Somatostatin labeled islet cells (solid arrows) at 5 dpf. c At 5 dpf, gck:GFP expression is rarely observed in Glucagon expressing α-cells (as labeled by anti-gcg antibody, solid arrows). Open arrows highlight hormone producing cells lacking gck:GFP staining. Scale bar: 50 µm.

EXPRESSION / LABELING:
Genes:
Antibodies:
Fish:
Anatomical Terms:
Stage: Day 5

Gck:GFP recapitulates gck expression and nutrient responses in the liver.

Transgenic gck:GFP expression in the liver (yellow outline) at 4 dpf (a), 5 dpf (b) and unfed 6 dpf larvae (c). gck:GFP expression in the liver is nutrient dependent after depletion of the yolk, showing low expression upon fasting or minimal diet from 6 to 10 dpf (d) and significantly elevated expression upon feeding a high fat diet (HFD) from 6 to 10 dpf (e). Scale bar: 200 µm. f Quantification of GFP signal in the liver of MIN and HFD fed larvae (N = 8). Dot and bar plot showing mean with SD. Statistical significance assessed by Mann–Whitney-test.

EXPRESSION / LABELING:
Gene:
Fish:
Conditions:
Anatomical Term:
Stage Range: Day 4 to Days 7-13
PHENOTYPE:
Fish:
Condition:
Observed In:
Stage: Days 7-13

Hepatic gck:GFP in diabetic pdx1-/- larvae is unaffected by nutrients.

a Experimental setup and timeline created in https://BioRender.com. Hepatic GFP expression at 6 dpf control and pdx1-/- larvae (b, c), and at 10 dpf following 5 days of minimal diet (b’, c’) or HFD (b”, c”). Signal in the gut is caused by autofluorescence of ingested food. Scale bar 200 µm. d Quantification of GFP signal in the liver of 6 dpf MIN and HFD fed control and pdx1-/- larvae. Dot plots with indicated mean. Statistical significance assessed by t-test. e Quantification of GFP signal in the liver of 10 dpf MIN and HFD fed control and pdx1-/- larvae. Dot plots with indicated mean. Statistical significance assessed by Two-way ANOVA, P-values of multiple comparisons are indicated. f Quantification of GFP signal in the liver of 6 and 10 dpf MIN and HFD fed control and pdx1−/− larvae. Dot plot with indicated mean, SD and lines connecting related groups. gGck gene expression levels analyzed via RT-qPCR in MIN and HFD fed control and pdx1-/- larvae (N > 3). Dot and bar plot shows mean with SD. Statistical significance assessed by Two-way ANOVA. P-values of multiple comparisons are indicated. h Measurement of Gck activity in MIN and HFD fed control and pdx1-/- larvae (N > 3) shown in a dot plot with indicated mean. Two-way ANOVA indicated a significant effect of the genotype (P = 0.0147), but no significant differences in the multiple comparison. Indicated P-values are from t-tests.

Gck:GFP expression in the islet in pdx1-/- diabetic larvae is reduced.

a, bgck:GFP and ins:dsRed labeled cells in the islets of 6 and 10 dpf control and pdx1-/- after MIN and HFD diet. Scale bar 50 µm. c, d Relative quantification of gck:GFP expressing cells and ins:dsRed labeled β-cells in the islet of pdx1-/- compared to controls at 6 dpf. Dot plots with indicated mean. Statistical significance assessed by t-test. e, f Relative quantification of gck:GFP expressing cells and ins:dsRed labeled β-cells in the islet of pdx1-/- compared to controls at 10 dpf. Dot plots with indicated mean. Statistical significance assessed by Two-way ANOVA, P-values of multiple comparisons are indicated. gInsulin gene expression levels analyzed via RT-qPCR under MIN and HFD feeding (N > 3). Dot and bar plot shows mean with SD. Statistical significance assessed by Two-way ANOVA. P-values of multiple comparisons are indicated.

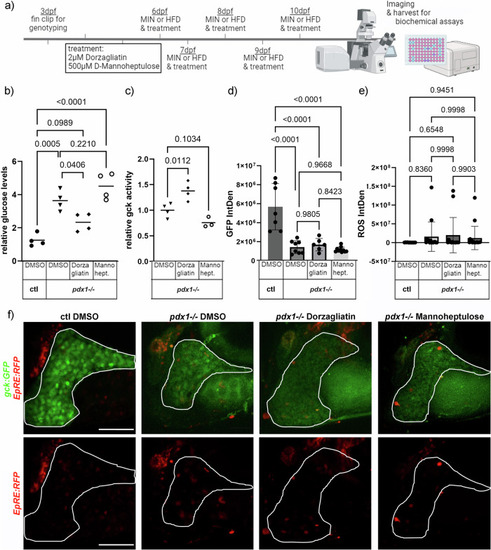
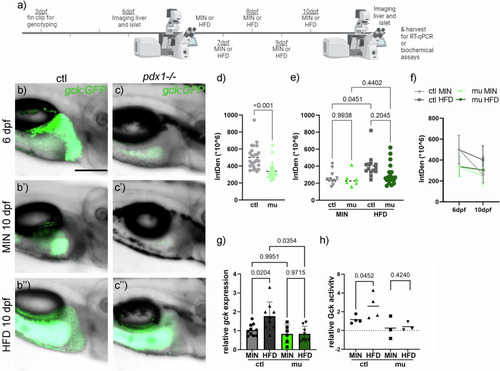
Activation of Gck ameliorates hyperglycemia.

a Experimental setup and timeline created in https://BioRender.com. b Glucose measurements of pdx1-/- after 5 days treatment with either 2 µM Dorzagliatin or 500 µM D-Mannoheptulose reveal a glucose lowering effect of Dorzagliatin (N = 4) as shown in a dot plot with indicated mean. Statistical significance assessed by One-way ANOVA. P-values of multiple comparisons are indicated. c Measurement of Gck activity in pdx1-/- following treatments as indicated (N > 3) as shown in a dot plot with indicated mean. Statistical significance assessed by One-way ANOVA. P-values of multiple comparisons are indicated. dgck:GFP expression following Dorzagliatin or D-Mannoheptulose treatment in pdx1-/- larvae. Stress-induced fluorescence signal quantification (e) and representative images (f) showing gck:GFP and oxidative stress as assessed by EpRE:RFP expression in the liver of control DMSO-treated and pdx1-/- treated with DMSO, Dorzagliatin or D-Mannoheptulose. (Liver is outlined in white). Dot and bar plot showing mean with SD. Statistical significance assessed by One-way ANOVA. P-values of multiple comparisons are indicated. Scale bar: 100 µm.

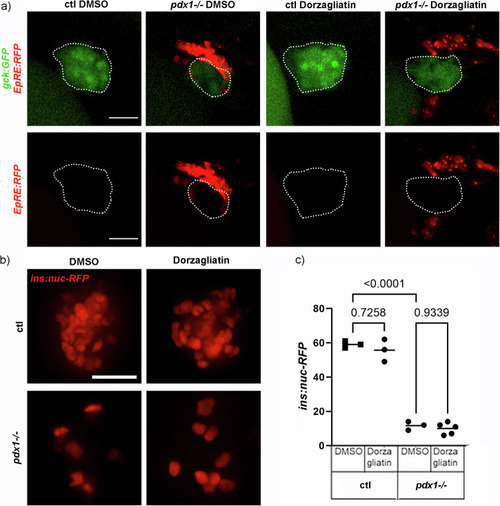
GKA Dorzagliatin does not induce oxidative stress in β-cells.

agck:GFP and EpRE:RFP expression in the endocrine islet (highlighted in white) of controls and pdx1-/- treated with DMSO and GKA Dorzagliatin. Scale bar: 20 µm. b β-cells labeled with H2B-RFP in control and pdx1-/- larvae treated with DMSO and Dorzagliatin. c The absolute β-cell numbers are unchanged upon treatment with Dorzagliatin in controls and pdx1-/- (N > 3) as shown in a dot plot with indicated mean Statistical significance assessed by One-way ANOVA (<0.0001), P-values of multiple comparisons are indicated.

Acknowledgments
This image is the copyrighted work of the attributed author or publisher, and ZFIN has permission only to display this image to its users. Additional permissions should be obtained from the applicable author or publisher of the image. Full text @ Commun Biol