IMAGE

Fig. 5

ID
ZDB-IMAGE-241126-42
Genes
Source
Figures for Schmitner et al., 2024
Image
Figure Caption

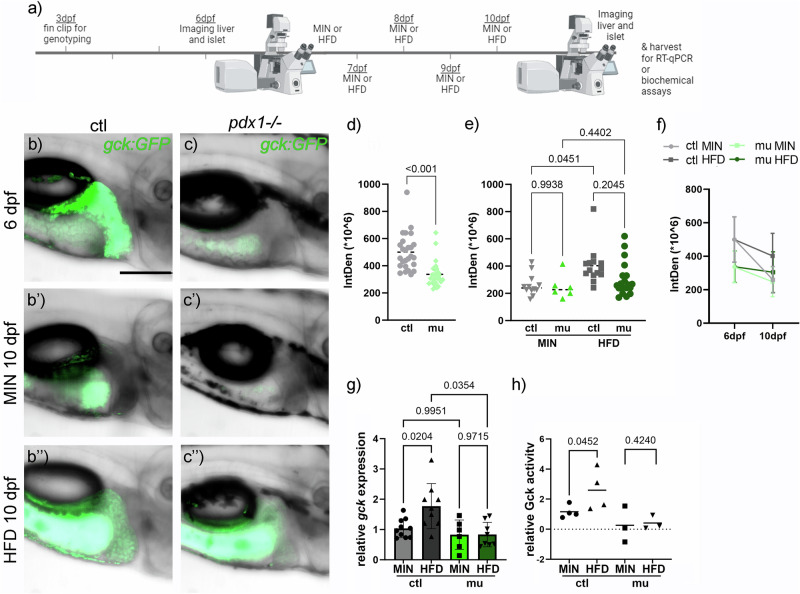
Fig. 5 Hepatic gck:GFP in diabetic pdx1-/- larvae is unaffected by nutrients.

a Experimental setup and timeline created in https://BioRender.com. Hepatic GFP expression at 6 dpf control and pdx1-/- larvae (b, c), and at 10 dpf following 5 days of minimal diet (b’, c’) or HFD (b”, c”). Signal in the gut is caused by autofluorescence of ingested food. Scale bar 200 µm. d Quantification of GFP signal in the liver of 6 dpf MIN and HFD fed control and pdx1-/- larvae. Dot plots with indicated mean. Statistical significance assessed by t-test. e Quantification of GFP signal in the liver of 10 dpf MIN and HFD fed control and pdx1-/- larvae. Dot plots with indicated mean. Statistical significance assessed by Two-way ANOVA, P-values of multiple comparisons are indicated. f Quantification of GFP signal in the liver of 6 and 10 dpf MIN and HFD fed control and pdx1−/− larvae. Dot plot with indicated mean, SD and lines connecting related groups. gGck gene expression levels analyzed via RT-qPCR in MIN and HFD fed control and pdx1-/- larvae (N > 3). Dot and bar plot shows mean with SD. Statistical significance assessed by Two-way ANOVA. P-values of multiple comparisons are indicated. h Measurement of Gck activity in MIN and HFD fed control and pdx1-/- larvae (N > 3) shown in a dot plot with indicated mean. Two-way ANOVA indicated a significant effect of the genotype (P = 0.0147), but no significant differences in the multiple comparison. Indicated P-values are from t-tests.

Figure Data
Acknowledgments
This image is the copyrighted work of the attributed author or publisher, and ZFIN has permission only to display this image to its users. Additional permissions should be obtained from the applicable author or publisher of the image. Full text @ Commun Biol