|
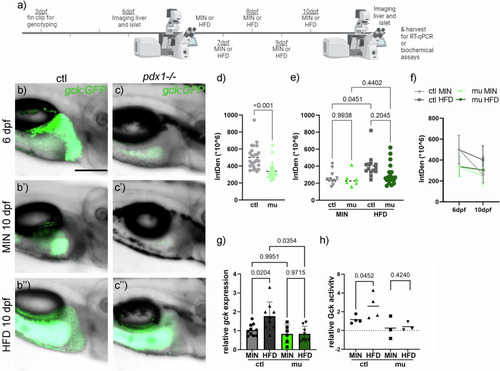
Hepatic gck:GFP in diabetic pdx1-/- larvae is unaffected by nutrients. a Experimental setup and timeline created in https://BioRender.com. Hepatic GFP expression at 6 dpf control and pdx1-/- larvae (b, c), and at 10 dpf following 5 days of minimal diet (b’, c’) or HFD (b”, c”). Signal in the gut is caused by autofluorescence of ingested food. Scale bar 200 µm. d Quantification of GFP signal in the liver of 6 dpf MIN and HFD fed control and pdx1-/- larvae. Dot plots with indicated mean. Statistical significance assessed by t-test. e Quantification of GFP signal in the liver of 10 dpf MIN and HFD fed control and pdx1-/- larvae. Dot plots with indicated mean. Statistical significance assessed by Two-way ANOVA, P-values of multiple comparisons are indicated. f Quantification of GFP signal in the liver of 6 and 10 dpf MIN and HFD fed control and pdx1−/− larvae. Dot plot with indicated mean, SD and lines connecting related groups. gGck gene expression levels analyzed via RT-qPCR in MIN and HFD fed control and pdx1-/- larvae (N > 3). Dot and bar plot shows mean with SD. Statistical significance assessed by Two-way ANOVA. P-values of multiple comparisons are indicated. h Measurement of Gck activity in MIN and HFD fed control and pdx1-/- larvae (N > 3) shown in a dot plot with indicated mean. Two-way ANOVA indicated a significant effect of the genotype (P = 0.0147), but no significant differences in the multiple comparison. Indicated P-values are from t-tests.
|