|
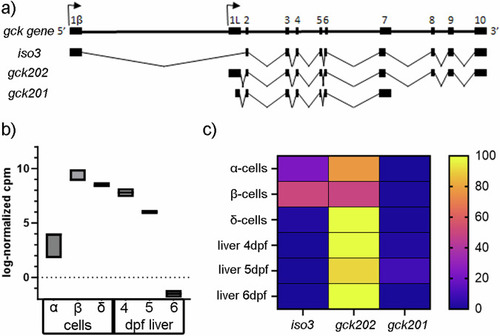
Gck isoforms and their expression in the zebrafish. a Genomic structure of the zebrafish gck gene and the three transcript isoforms. Exons are indicated by black rectangles and introns by lines, curved arrows represent the sites of transcription initiation. b Quantification of overall gck RNA counts from sorted adult zebrafish pancreatic cells (N = 3 biological replicates)28 and embryonic hepatocytes (N = 2 biological replicates for each time point)29. Plot shows Min to Max. c Heat map showing gck isoform expression in sorted zebrafish pancreatic α-, β- and δ-cells and embryonic hepatocytes at 4–6 dpf using the same published datasets28,29 and the improved zebrafish transcriptome annotation of Lawson et al.26.
|