IMAGE

Fig. 7

ID
ZDB-IMAGE-241126-44
Genes
Source
Figures for Schmitner et al., 2024
Image
Figure Caption

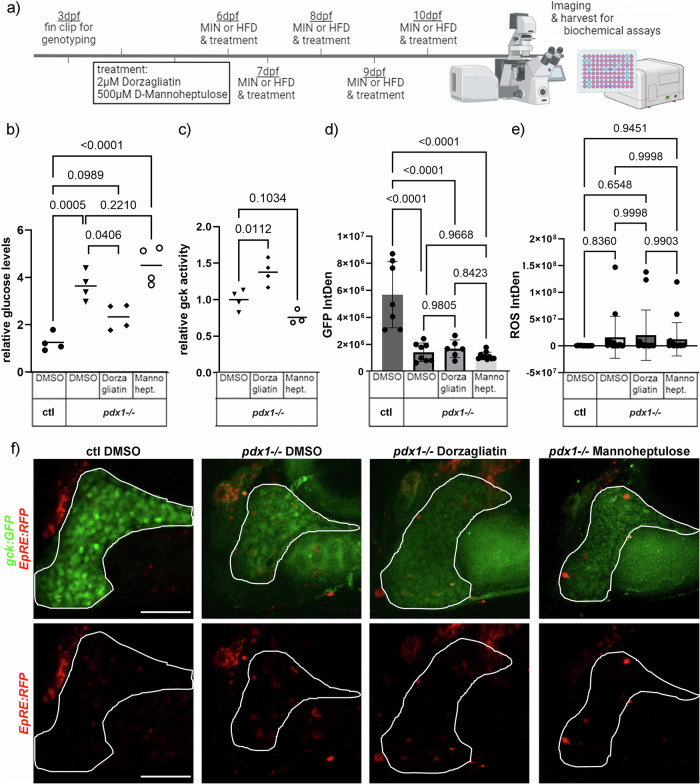
Fig. 7 Activation of Gck ameliorates hyperglycemia.

a Experimental setup and timeline created in https://BioRender.com. b Glucose measurements of pdx1-/- after 5 days treatment with either 2 µM Dorzagliatin or 500 µM D-Mannoheptulose reveal a glucose lowering effect of Dorzagliatin (N = 4) as shown in a dot plot with indicated mean. Statistical significance assessed by One-way ANOVA. P-values of multiple comparisons are indicated. c Measurement of Gck activity in pdx1-/- following treatments as indicated (N > 3) as shown in a dot plot with indicated mean. Statistical significance assessed by One-way ANOVA. P-values of multiple comparisons are indicated. dgck:GFP expression following Dorzagliatin or D-Mannoheptulose treatment in pdx1-/- larvae. Stress-induced fluorescence signal quantification (e) and representative images (f) showing gck:GFP and oxidative stress as assessed by EpRE:RFP expression in the liver of control DMSO-treated and pdx1-/- treated with DMSO, Dorzagliatin or D-Mannoheptulose. (Liver is outlined in white). Dot and bar plot showing mean with SD. Statistical significance assessed by One-way ANOVA. P-values of multiple comparisons are indicated. Scale bar: 100 µm.

Figure Data
Acknowledgments
This image is the copyrighted work of the attributed author or publisher, and ZFIN has permission only to display this image to its users. Additional permissions should be obtained from the applicable author or publisher of the image. Full text @ Commun Biol