
- Title
-
Investigating the role of dachshund b in the development of the pancreatic islet in zebrafish
- Authors
- Yang, L., Webb, S.E., Jin, N., Lee, H.M., Chan, T.F., Xu, G., Chan, J.C.N., Miller, A.L., Ma, R.C.W.
- Source
- Full text @ J Diabetes Investig
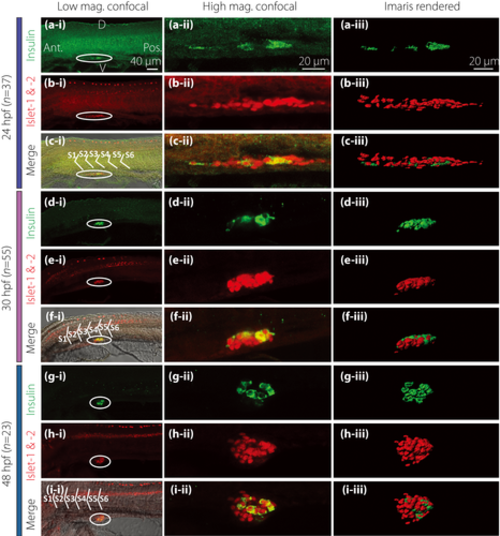
Morphology of the pancreatic islet and β-cells at 24, 30 and 48 h post-fertilization (hpf). Embryos were fixed at (a–c) 24 hpf (n = 37), (d–f) 30 hpf (n = 55) and (g–i) 48 hpf (n = 23). They were then de-yolked and whole-mount double-immunolabeled with antibodies against insulin (green) and islet 1 and 2 (red) to show the localization of the β-cells and islet cells in the endocrine pancreas, respectively. All images were acquired with the Leica TCS SP5 II laser scanning confocal system. The images shown in panels a-i to i-i were acquired at low magnification (i.e., with a ×20 HC PL APO objective lens), whereas those shown in panels a-ii to i-ii were acquired at a higher magnification (i.e., with a ×63 HCX PL APO water-dipping objective lens). These are all single optical sections taken through the middle of the pancreatic islet. The images shown in panels a-iii to i-iii are stacks of optical images rendered as 3-D images by the image analysis software, Imaris. (a,d,g) The localization of insulin-positive β-cells (in green). (b,e,h) The localization of the islet cells (in red). (c-i,f-i,i-i) The co-localization of insulin, islet 1 and 2 and bright-field image. (c-ii,f-ii,i-ii) The co-localization of insulin and islet 1 and 2. D, dorsal; Ant., anterior; Pos., posterior; S, somite; V, ventral. |
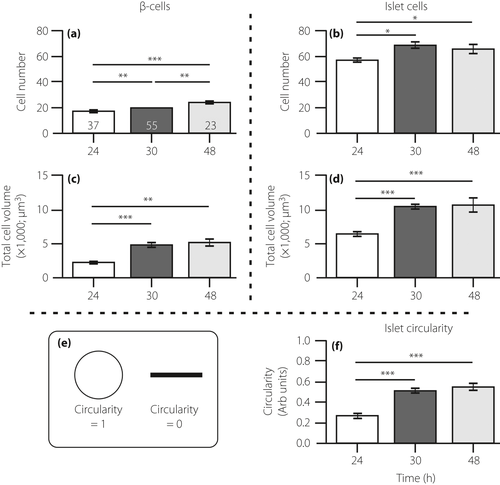
Quantification of the immunolabeling results. Embryos were fixed at 24, 30 and 48 h post-fertilization (hpf), after which the β-cells and islet cells were dual-immunolabeled with an insulin antibody and islet 1 and 2 antibody, respectively. These bar graphs show the number of (a) β-cells and (b) islet cells; the volume of cells expressing (c) insulin and (d) islet 1 and 2; and (e,f) the circularity of the islet, such that a more rounded islet has a circularity value approaching 1, whereas a more elongated islet has a circularity value near to 0. The data are shown as the mean ± standard error of n = 37, n = 55 and n = 23, at 24 hpf, 30 hpf and 48 hpf, respectively, as shown in the bars in (a). The asterisks indicate the significance difference at P < 0.05*, P < 0.01** or P < 0.001*** using the Mann–Whitney U-test. |
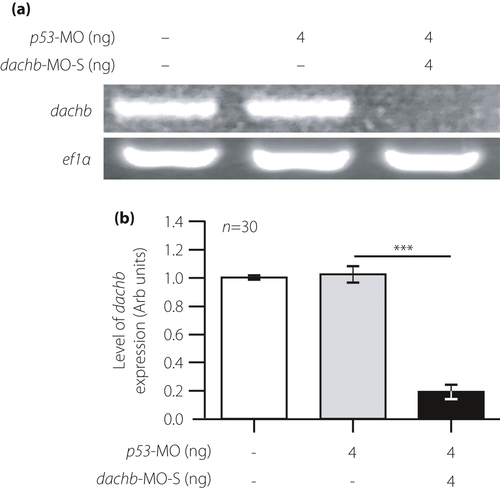
Confirming the knockdown ability of the splice-blocking dachb-morpholino (dachb-MO-S). (a) Reverse transcription polymerase chain reaction and (b) quantitative reverse transcription polymerase chain reaction showing the expression of dachb relative to ef1α in embryos at 30 h post-fertilization, after injection at the single-cell stage with either the p53-MO or the dachb-MO-S. ef1α was used as an internal control. (b) The data are shown as the mean ± standard error of n = ~30 embryos (acquired on four different occasions) for each of the three experimental conditions used. The asterisks indicate that after injection with the dachb-MO-S, the level of dachb express+ion was significantly reduced (at P < 0.001***; ANOVA Tukey’s test) when compared with that in the p53-MO-injected group. |
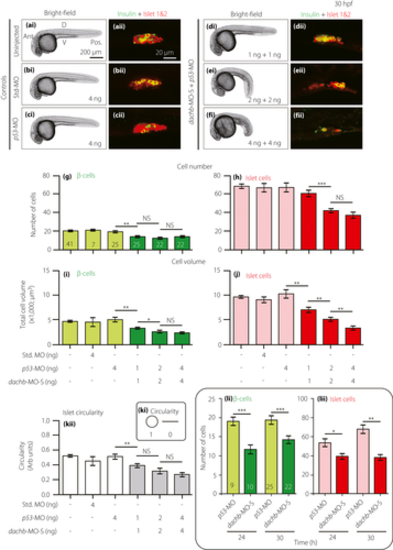
Splice-blocking dachb-morpholino (dachb-MO-S) knockdown inhibits the development of the pancreatic islet- and β-cells. Embryos were (a) uninjected (control) or injected at the one-cell stage with (b) 4 ng standard MO (Std. MO; control), (c) 4 ng p53-MO (control) or (d,e,f) a combination of p53-MO and dachb-MO-S at (d) 1 ng + 1ng, (e) 2 ng + 2 ng or (f) 4 ng + 4 ng. (ai-fi) Bright-field images were acquired at 30 h post-fertilization (hpf), after which the embryos were whole-mount double-immunolabeled with antibodies to insulin (green) and islet 1 and 2 (red) to show the localization of the β-cells and islet cells in the endocrine pancreas, respectively. (aii–fii) These are all single optical sections taken through the middle of pancreatic islet. (g–h) The number of (g) β-cells and (h) islet cells, and (i,j) the volume of (i) β-cells and (j) islet cells. (k) The circularity of the pancreatic islet. (l) Bar charts showing the numbers of (li) β-cells and (lii) islet cells in embryos at 24 hpf and 30 hpf after they were injected at the one-cell stage with either p53-MO (controls) or p53-MO and dachb-MO-S (at the amounts described above). The data are presented as the mean ± standard error of the mean of n = 7 to 41 embryos, such that the number is shown in the respective bars in panel (g). The asterisks indicate significant differences at P < 0.05*, P < 0.01** or P < 0.001*** using the Mann–Whitney U-test. Ant., anterior; D, dorsal; NS, not significant; Pos. posterior; V, ventral. |
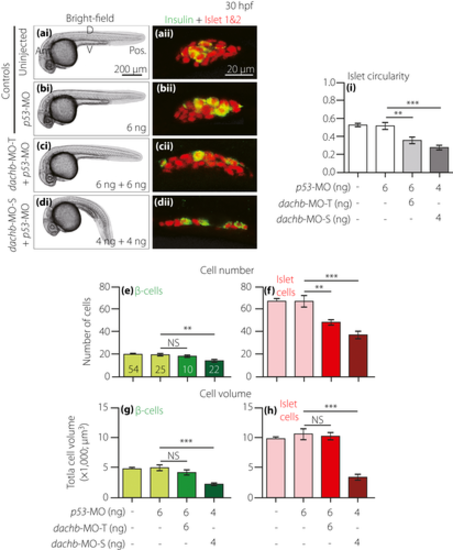
Comparison of dachb knockdown with translation-blocking morpholino (dachb-MO-T) and splice-blocking dachb-MO (dachb-MO-S) on the development of the pancreatic islet. Embryos were (a) uninjected (control) or they were injected at the one-cell stage with (b) 6 ng p53-MO (control), (c) 6 ng dachb-MO-T + 6 ng p53-MO or (d) 4 ng dachb-MO-S + 4 ng p53-MO. (ai–di) Bright-field images were acquired at 30 hpf, after which the embryos were whole-mount double-immunolabeled with antibodies to insulin (green) and islet 1 and 2 (red) to show the localization of the β-cells and islet cells in the endocrine pancreas, respectively. (aii–dii) These are all single optical sections taken through the middle of the pancreatic islet. (e,f) The number of (e) β-cells and (f) islet cells, and (g,h) the volume of (g) β-cells and (h) islet cells. (i) The circularity of the pancreatic islet. The data are presented as the mean ± standard error of n = 10 to 54 embryos, such that the number is shown in the respective bars in panel (e). The asterisks indicate significant differences at P < 0.01** or P < 0.001*** using the Mann–Whitney U-test. Ant., anterior; D, dorsal; NS, not significant; Pos. posterior; V, ventral. PHENOTYPE:
|
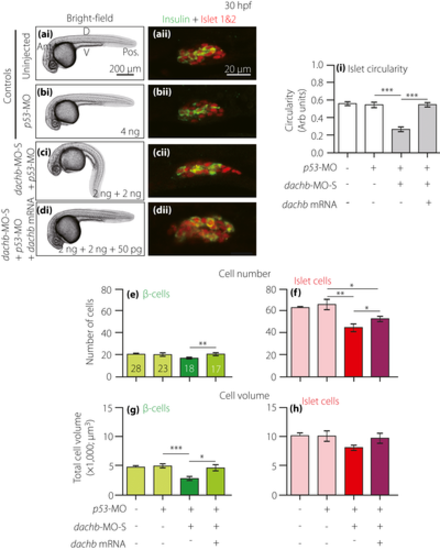
Injection of dachb messenger ribonucleic acid (mRNA) rescues the effect of splice-blocking dachb-morpholino (dachb-MO-S) on the development of the pancreatic islet in embryos at 30 h post-fertilization (hpf). Embryos were (a) uninjected (control) or they were injected at the one-cell stage with (b) p53-MO (control), (c) 2 ng dachb-MO-S + 2 ng p53-MO or (d) 2 ng dachb-MO-S + 2 ng p53-MO + 50 pg dachb mRNA. (ai–di) Bright-field images were acquired at 30 hpf, after which the embryos were whole-mount double-immunolabeled with antibodies to insulin (green) and islet 1 and 2 (red) to show the localization of the β-cells and islet cells in the endocrine pancreas, respectively. (aii–dii) These are all single optical sections taken through the middle of pancreatic islet. (e,f) The number of (e) β-cells and (f) islet cells, and (g,h) the volume of (g) β-cells and (h) islet cells. (i) The circularity of the pancreatic islet. The data are presented as the mean ± standard error of n = 10 to 28 embryos, such that the number is shown in the respective bars in panel (e). The asterisks indicate significant differences at P < 0.05*, P < 0.01** or P < 0.001*** using the Mann–Whitney U-test. Ant., anterior; D, dorsal; NS, not significant; Pos. posterior; V, ventral. |
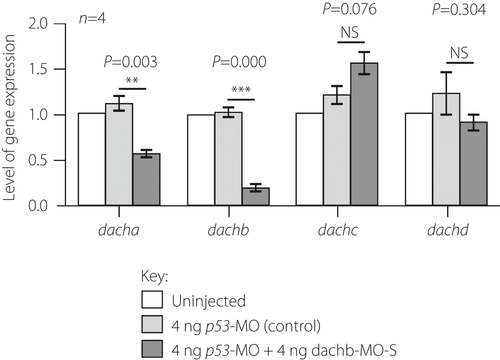
Effect of dachb knockdown on the expression of dach genes. Embryos were either uninjected or they were injected with 4 ng p53-MO or with 4 ng splice-blocking dachb-morpholino (dachb-MO-S) + 4 ng p53-MO and then the reverse transcription polymerase chain reaction was carried out to determine any changes in the expression of dacha, dachb, dachc and dachd. As expected, the expression of dachb was downregulated significantly in the p53-MO + dachb-MO group when compared with the two control groups. There was also a significant reduction of dacha expression compared with the control groups. The data are presented as the mean ± standard error of four experiments per treatment. The asterisks indicate p53-MO + dachb-MO data that are significantly different from the p53-MO alone injected controls for each of the four genes at P < 0.01** or P < 0.001*** using the Student’s t-test. NS, not significant. |
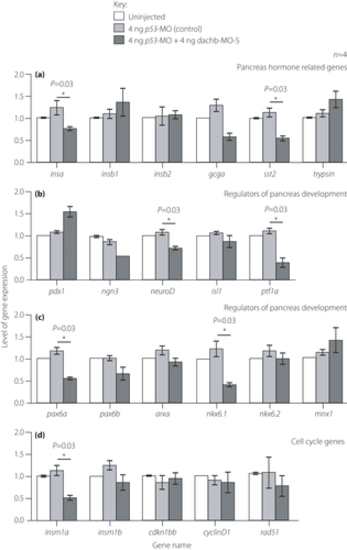
Zebrafish embryos that were co-injected with 4 ng splice-blocking dachb-morpholino (dachb-MO-S) + 4 ng p53-MO showed an altered expression of a number of other genes at 30 h post-fertilization. Embryos were either uninjected or else they were injected with 4 ng p53-MO or with 4 ng dachb-MO-S + 4 ng p53-MO and then the reverse transcription polymerase chain reaction was carried out to determine any changes in the expression of various (a) pancreas hormone-related genes; (b,c) regulators of pancreas development; and (c) cell cycle genes.The data are presented as the mean ± standard error of four experiments conducted per treatment. The asterisks indicate p53-MO + dachb-MO data that are significantly different from the p53-MO alone injected controls at P < 0.05* using the Mann–Whitney U-test. |
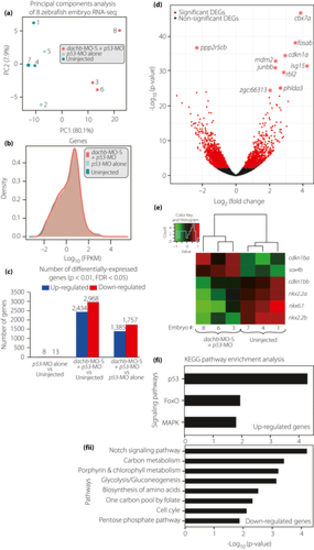
dachb knockdown changed the messenger ribonucleic acid (RNA) transcriptome profile of zebrafish embryos at 30 h post-fertilization. (a) Principal components analysis of the RNA sequencing (RNA-Seq) datasets. Each data point represents a zebrafish RNA-Seq sample and the color represents the sample group: splice-blocking dachb-morpholino (dachb-MO-S) + p53-MO (red), p53-MO alone (light cyan) and uninjected control (dark cyan). (b) Density distribution plots of log expression level (fragments per kilobase of transcript per million) for all genes in the dachb-MO-S + p53-MO (red), p53-MO alone (light cyan) and uninjected control (dark cyan) groups. (c) Number of differentially expressed genes (P < 0.01, false discovery rate <0.05) in the three comparison groups. (d) Volcano plot of log2(Fold Change) versus –log10(P-value) for all 27,957 genes in the dachb-MO-S + p53-MO versus p53-MO alone groups. Differentially expressed genes are in red (P < 0.01, false discovery rate <0.05). The 10 most significant differentially expressed genes in terms of P-value are labeled. (e) Comparison of the level of expression of genes known to be involved in pancreas development after injection with dachb-MO-S + p53-MO, compared with uninjected controls. (f) Significantly enriched KEGG pathways (P < 0.05, false discovery rate <0.2) of (fi) up- and (fii) downregulated genes in the dachb-MO-S + p53-MO versus p53-MO alone groups. |