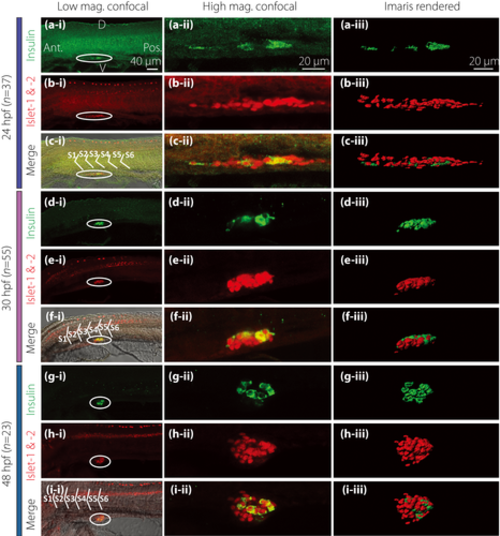
Morphology of the pancreatic islet and β-cells at 24, 30 and 48 h post-fertilization (hpf). Embryos were fixed at (a–c) 24 hpf (n = 37), (d–f) 30 hpf (n = 55) and (g–i) 48 hpf (n = 23). They were then de-yolked and whole-mount double-immunolabeled with antibodies against insulin (green) and islet 1 and 2 (red) to show the localization of the β-cells and islet cells in the endocrine pancreas, respectively. All images were acquired with the Leica TCS SP5 II laser scanning confocal system. The images shown in panels a-i to i-i were acquired at low magnification (i.e., with a ×20 HC PL APO objective lens), whereas those shown in panels a-ii to i-ii were acquired at a higher magnification (i.e., with a ×63 HCX PL APO water-dipping objective lens). These are all single optical sections taken through the middle of the pancreatic islet. The images shown in panels a-iii to i-iii are stacks of optical images rendered as 3-D images by the image analysis software, Imaris. (a,d,g) The localization of insulin-positive β-cells (in green). (b,e,h) The localization of the islet cells (in red). (c-i,f-i,i-i) The co-localization of insulin, islet 1 and 2 and bright-field image. (c-ii,f-ii,i-ii) The co-localization of insulin and islet 1 and 2. D, dorsal; Ant., anterior; Pos., posterior; S, somite; V, ventral.
|
