
|
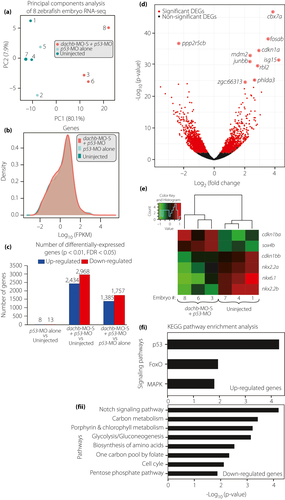
Fig. 9 dachb knockdown changed the messenger ribonucleic acid (RNA) transcriptome profile of zebrafish embryos at 30 h post-fertilization. (a) Principal components analysis of the RNA sequencing (RNA-Seq) datasets. Each data point represents a zebrafish RNA-Seq sample and the color represents the sample group: splice-blocking dachb-morpholino (dachb-MO-S) + p53-MO (red), p53-MO alone (light cyan) and uninjected control (dark cyan). (b) Density distribution plots of log expression level (fragments per kilobase of transcript per million) for all genes in the dachb-MO-S + p53-MO (red), p53-MO alone (light cyan) and uninjected control (dark cyan) groups. (c) Number of differentially expressed genes (P < 0.01, false discovery rate <0.05) in the three comparison groups. (d) Volcano plot of log2(Fold Change) versus –log10(P-value) for all 27,957 genes in the dachb-MO-S + p53-MO versus p53-MO alone groups. Differentially expressed genes are in red (P < 0.01, false discovery rate <0.05). The 10 most significant differentially expressed genes in terms of P-value are labeled. (e) Comparison of the level of expression of genes known to be involved in pancreas development after injection with dachb-MO-S + p53-MO, compared with uninjected controls. (f) Significantly enriched KEGG pathways (P < 0.05, false discovery rate <0.2) of (fi) up- and (fii) downregulated genes in the dachb-MO-S + p53-MO versus p53-MO alone groups.