
- Title
-
In vivo imaging of emerging endocrine cells reveals a requirement for PI3K-regulated motility in pancreatic islet morphogenesis.
- Authors
- Freudenblum, J., Iglesias, J.A., Hermann, M., Walsen, T., Wilfinger, A., Meyer, D., Kimmel, R.A.
- Source
- Full text @ Development
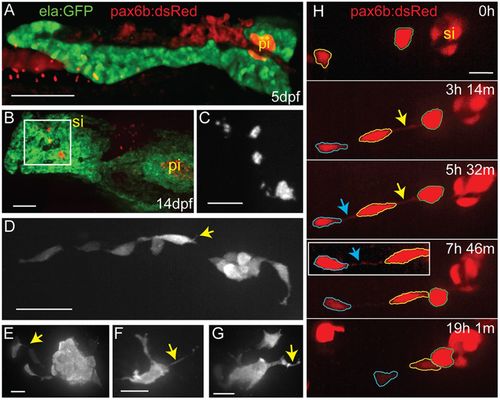
Endocrine cells display complex morphologies during secondary islet assembly. (A) Maximal projection of confocal stack of the pancreas at 5 dpf, imaged in a living zebrafish larva. Fluorescent transgenes label the exocrine (ela:GFP, green) and endocrine (pax6b:dsRed, red) compartments. (B) Maximal projection of confocal stack of fixed and microdissected pancreas from 14 dpf ela:GFP;pax6b:dsRed transgenic larva. This image was assembled by stitching together images of partially overlapping regions, using the Pairwise Stitching plug-in for ImageJ (Preibisch et al., 2009). pi, principal islet; si, secondary islet. (C) Close-up of pax6b:dsRed+ secondary islets (gray) from boxed region in B. (D-G) Confocal z-stack projections of secondary islet cells and clusters from samples as in B, showing pax6b:dsRed transgene expression (gray). Yellow arrows highlight cell protrusions. (H) Confocal image series (maximum projections) of endocrine cells in the posterior pancreas of a pax6b:dsRed transgenic larva beginning at 14 dpf, with subsequent images acquired at the times indicated (h, hours; m, minutes). Outlines (blue, yellow and green) indicate individual cells that move into closer proximity to each other and to a pre-existing secondary islet. Arrows indicate fine cell-cell connections. Inset, cell-cell connections become visible with contrast enhancement (blue arrow). Nonlinear gamma adjustment was applied to highlight fine protrusions and cell-cell connections. Scale bars: 100 µm in A,B; 50 µm in C; 25 µm in D; 10 µm in E-H; |
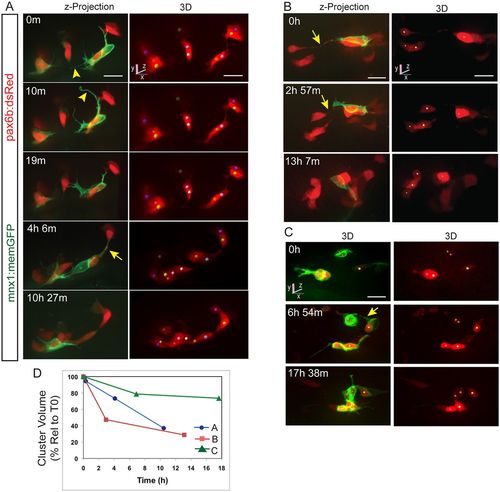
Clustering endocrine cells extend dynamic protrusions. (A-C) Image series acquired by confocal microscopy showing pancreatic endocrine cells in pax6b:dsRed;mnx1:memGFP transgenics at 7 dpf, following Notch inhibitor treatment from 4 dpf to 5 dpf. Shown are maximum intensity projections (A,B, left) and 3D representations of tracked cells (colored spheres), rotated to best visualize individual cells (A,B, right, C). mnx1:memGFP transgene expression delineates dynamic protrusions (arrowheads). Arrows indicate fine cell-cell connections. (D) Progression of cell clustering over time. Clustering is quantitated as the volume of a convex 3D polygon enclosing the cell centers (see Fig. S3A), plotted against time for the samples shown in A-C. Volume decreases over time as cells come into closer proximity (for details see the supplementary Materials and Methods). Scale bars: 10 μm. |
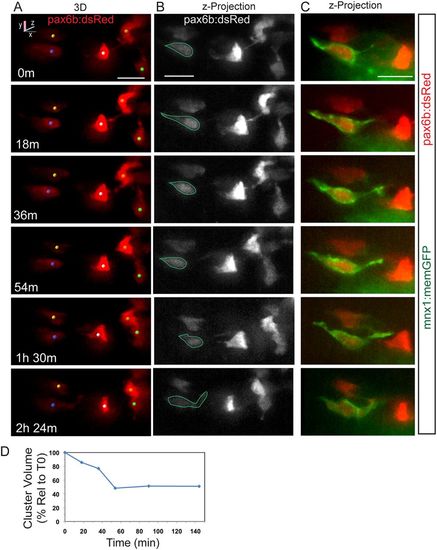
Dynamics of cell coalescence. (A) Confocal time-lapse series of Notch inhibitor-treated pax6b:dsRed; mnx1:memGFP transgenic at 7 dpf showing coalescence of two cells (orange and green spheres). Three additional cells are tracked. (B) z-projections corresponding to the images in A, with RFP rendered in gray. (C) Two-channel, close-up view of the GFP+ cell outlined in B (green). A subset of images from a series collected at 18 min intervals are shown. Scale bars: 10 µm. (D) Quantitation of clustering (as in Fig. 2D) for the tracked cells indicated in A. |
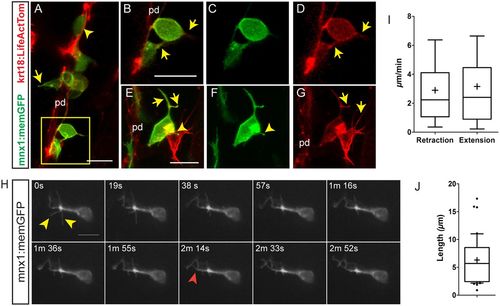
Emerging endocrine cells extend protrusions. Confocal image stacks of differentiating pancreatic endocrine cells in living 6 dpf krt18:LifeActTom;mnx1:memGFP transgenics following Notch inhibitor treatment from 4 dpf to 5 dpf. Shown are maximum intensity projections (A,E-G) and single z-slices (B-D). pd, pancreatic duct. (A) A rounded GFP+/LifeActTom+ early beta cell found within the duct (arrowhead); the cell leaving the duct has a narrow protrusion (arrow). (B-D) Close-up of the boxed region from A, showing merged (B) and single channels (C,D). GFP+/LifeActTom+ early beta cells extend actin-rich processes (arrows). (E-G) Thin actin-rich processes (arrows) project and connect two LifeActTom+ cells (arrowhead) in close proximity to the duct. The GFP+ cell is a nascent beta cell, whereas the GFP− cell is likely to represent a differentiating non-beta endocrine cell. (H) Maximum intensity projections at the indicated time points of time-lapse series acquired by spinning disc microscopy of Notch inhibitor-treated larva analyzed at 6 dpf. Nonlinear gamma adjustment was applied to enhance low contrast signals. Dynamic extension (red arrowhead) and retraction (yellow arrowheads) of fine protrusions were detected. (I) Quantitation of instantaneous retraction and extension rates analyzed from images captured as in H. (J) Maximal filopodia lengths from image series as in H. In box-whisker plots, whiskers represent 10-90%, outliers are indicated by dots, and the mean is indicated by ‘+’. Sample details are provided in the supplementary Materials and Methods. Scale bars: 10 µm in A-H. |
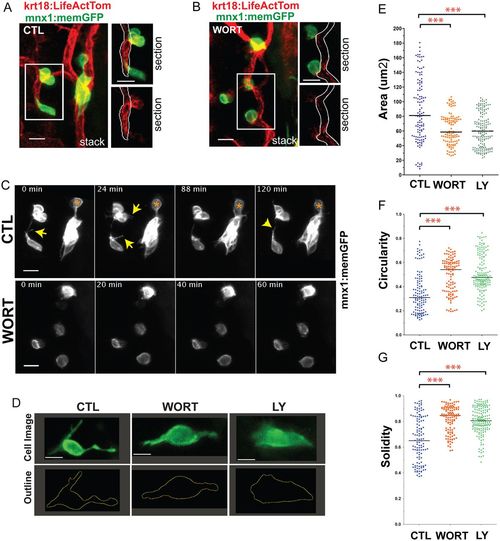
PI3K inhibition impacts cell morphologies and dynamics. (A,B) (Left) Maximum intensity projections of confocal image stacks of early beta cells in (A) control (CTL) and (B) Wortmannin-treated (WORT) 7 dpf krt18:LifeActTom;mnx1:memGFP transgenics following islet induction at 4 dpf. (Right) Single z-planes from the boxed regions of the image stack (top, merge; bottom, single channel, LifeActTom) with the duct indicated (white outline). (C) Selected time points from time-lapse image series of samples from A and B. Arrows indicate protrusions. Asterisk indicates a cell that moves closer to the cluster. (D) Single images from time-lapse series, showing individual nascent beta cells in mnx1:memGFP transgenics treated to induce secondary islets from 4-5 dpf, followed by treatment at 6 dpf as indicated (WORT, 100 nM Wortmannin; LY, 50 µm Ly294002; CTL, DMSO), for 3-4 h prior to imaging (top row). The lower panels show the cell outline used for quantitative morphology analysis. (E-G) Cell area (E), circularity (F) and solidity (G) measured in individual frames of time-lapse series (see Fig. S3). ***P<0.0001, one-way ANOVA with Dunnett's post-test. CTL, 14 embryos, 118 time points; WORT, 14 embryos, 111 time points; LY, 13 embryos, 162 time points. Additional sample information is provided in Table S4. Scale bars: 10 µm in A-C; 5 µm in D. |
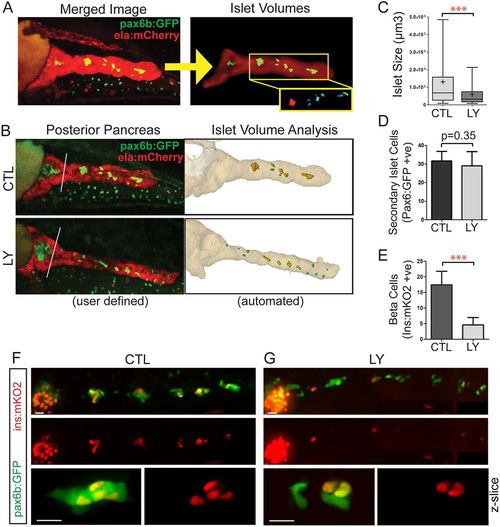
PI3K inhibition interferes with islet assembly assay. (A) Secondary islet analysis is based on the identification and three-dimensional segmentation of exocrine pancreas as labeled by ela:mCherry expression. (B) With our automated script, the user defines the posterior pancreas based on a composite image of the middle slice of ela:mCherry (red channel) and a z-projection of the pax6b:GFP image stack (left, white line). The custom software automatically delineates the whole pancreas and secondary islets (right). (C) Quantitation of secondary islet size of the samples analyzed in Fig. S10B-D, using the automated method. In box-whisker plots, box extends from the 25th to 75th percentile, whiskers indicate 5th and 95th percentile, line at median, ‘+’ indicates mean. ***P<0.001, Mann–Whitney test (one-tailed). CTL, n=10 larvae, 133 objects, LY, n=8 larvae, 80 objects. (D) pax6b:GFP+ cells in the posterior pancreas of embryos treated as in C. Mean±s.d. CTL, n=13; LY, n=9. Unpaired t-test. (E) ins:mKO2+ cells at 8 dpf in samples treated as in C. CTL, n=16; LY, n=14. Mean±s.d. Unpaired t-test, ***P<0.0001. (F,G) Representative images of 8 dpf pax6b:GFP;ins:mKO2 larvae. Control (F) or treated from 6 dpf to 8 dpf with 15 μM Ly294002 (G). Overview images (F,G, top and middle) were assembled by stitching together images of partially overlapping regions using the Pairwise Stitching plug-in for ImageJ (Preibisch et al., 2009). Scale bars: 50 µm. (F,G, bottom) Single slices from z-stacks of higher magnification images. Scale bars: 10 µm. |
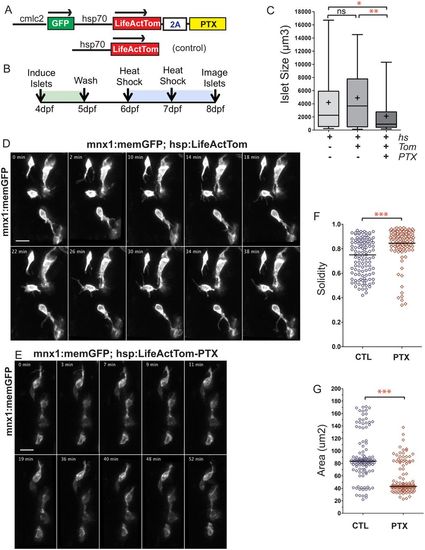
GPCR inhibition disrupts islet assembly. (A) Transgene hsp70:LifeActTom-PTX was used to inducibly express pertussis toxin (PTX, top). The transgene hsp70:LifeActTom served as a control (bottom). (B) Scheme of islet assembly experiment with heat shock induction of PTX. (C) Islet volume quantitation of heat shock-treated controls (n=12, 99 objects), compared with larvae with induced expression of LifeActTom (n=14, 120 objects), or LifeActTom-PTX (n=6, 61 objects). Images were captured on a Zeiss LSM5 and volume quantitation performed using ImageJ (minimum object size 100 µm3). *P<0.05, **P<0.01, Kruskal–Wallis test followed by Dunn's multiple comparison test. ns, not significant. Results are representative of two independent experiments. (D,E) Selected confocal projections from time-lapse series of control (D) and PTX-expressing (E) transgenic larvae at 7 dpf, 4 or more hours following a heat shock. Scale bars: 10 μm. (F,G) Quantitation of cell solidity (F) and area (G) measured in individual frames of time-lapse series with images acquired at 4 min intervals (as shown in Fig. S16A,B). ***P<0.0001, Mann–Whitney test, two-tailed. Data are combined from a total of eight control and eight PTX-expressing larvae analyzed in three separate experiments. Control samples include non-heat-shocked hsp70:PTX transgenics, and LifeActTom+ heat-shocked samples. Additional sample information is provided in Table S5. |
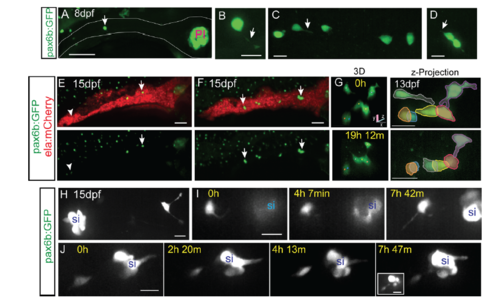
Morphology and dynamics of naturally occurring secondary islet cells. Related to figure 1. (A) Maximal projection of confocal stack of pax6b:dsRed transgenic at 8 dpf. Scale bar = 50μm. (B) Close-up view of endocrine cell (in A, arrow), which displays a long protrusion (B, arrow). (C, D) Close-up views of secondary endocrine cells in samples as in A. Arrows indicate cell protrusions. (B-D) Scale bars = 10μm. (E, F) Maximal projections of confocal stacks of pax6b:dsRed;ela:mCherry transgenic at 15 dpf. Larvae show variable islet development, ranging from small islets (arrow, E) and single cells (arrowhead, E), to larger clusters (arrows, F). Scale bar = 50μm. (G) Islet cells at times indicated in 13 dpf pax6b:GFP transgenic. 3D view (left) showing tracked cells (colored spheres), maximal projection (right) with cells pseudocolored to highlight cell movements. Single time point (H) and image series at times indicated (I-J) from 15 dpf pax6b:GFP transgenics. Single cells show protrusions (H, I) and move closer to existing secondary islets (I, J). Increasing contrast reveals cell protrusions (J, right, inset). PI, principal islet; si, secondary islet. (G-J) Scale bar = 10μm. (For sample details see Tables S1, S2, S3.) |
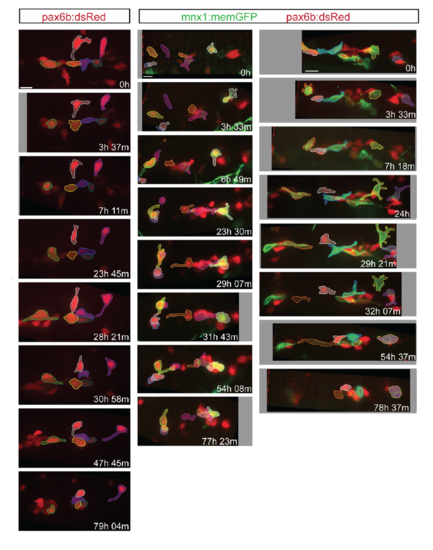
Induced endocrine cells cluster over ≥72 hours. Islet morphogenesis was followed in pax6b:dsRed (left) and pax6b:dsRed;mnx1:memGFP (center, right) transgenics beginning at 6dpf, by a modified catch-and-release approach (see Supplementary Methods), following Notch inhibitor treatment at 4 dpf for 24 hours. Selected cells are labeled by pseudocoloring to facilitate identification in subsequent images. Scale bars = 10μm. Sample details are described in Supplementary Methods. |
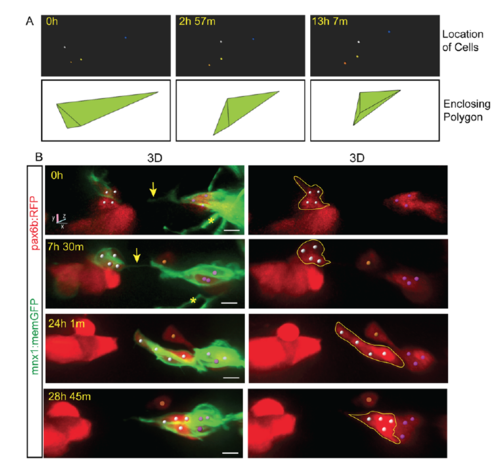
Protrusion formation coincides with endocrine cell movements and clustering. Related to Figure 2. (A, top) Tracked cells (colored spheres) shown alone, from the time series shown in Fig 2B. (A, bottom) Enclosing polygon as calculated using Matlab. Polygon volume reflects the spread of cells in three-dimensional space, and thus provides an index of cell clustering. (B) Image series of pancreatic endocrine cells in pax6b:dsRed;mnx1:memGFP transgenics following Notch inhibitor treatment from 4 dpf to 5 dpf, and imaged at 6 dpf. 3D representations with cells tracked (colored spheres) using Imaris. Movement of cells follows the appearance of a fine intercellular tether (arrow). Scale bars = 10μm. *Indicates neurite projections from mnx1:memGFP transgene expressed in overlying neurons. |
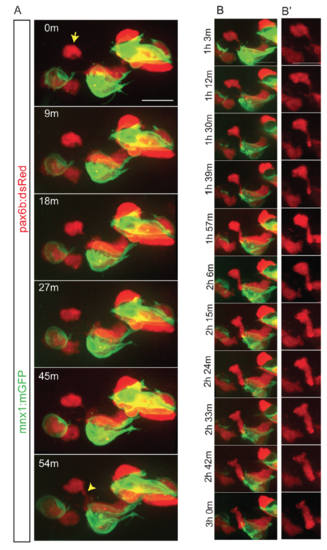
Dynamics of cell coalescence. Related to Figure 3. Z-projections from time-lapse image series of pancreatic endocrine cells in pax6b:dsRed;mnx1:memGFP transgenics following Notch inhibitor treatment at 4 dpf. Sample was imaged at 7 dpf, with images acquired every 9 minutes. (A) The indicated cell (arrow) forms a connection to a nearby cluster which strengthens over time (bottom frame, arrowhead). (B) Further time points of the sample shown in (A), projections of a subset of zslices to highlight cell shape changes that accompany coalescence of a single cell with a cluster. (B') dsRed channel shown alone for clarity. Scale bars = 10μm. |
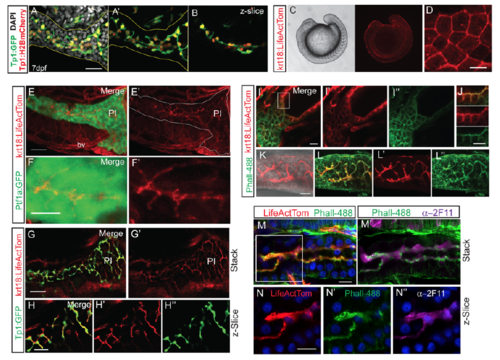
Pancreatic duct morphology delineated with krt18:LifeActTom transgene. (A) Maximal projection of confocal z-stack showing pancreatic duct morphology at 7 dpf delineated by expression of Tp1:H2BmCherry (red, nuclear) and Tp1:GFP (green, cytoplasmic), immunostained for GFP. Nuclei (gray) are stained by DAPI. Pancreas is delineated by yellow outline. (A’) Image as in (A) with DAPI signal removed. (B) Single zslice of sample shown in (A). (C) Widefield view showing krt18:LifeActTom transgene expression in surface epithelium in 15-somite stage embryo (right), with corresponding brightfield view (left). (D) Maximum intensity projection of confocal stack of surface epithelium of embryo as in (C), showing actin accumulation at cell-cell junctions. Scale bar = 25μm. (E-F) Projection of confocal stack through the pancreas in krt18:LifeActTom;ptf1a:GFP larva at 6 dpf. (E'-F’) krt18:LifeActTom expression, with GFP channel removed. (E’) Pancreas as defined by ptf1a:GFP, is outlined in white. LifeActTom is also expressed in some blood vessels (bv). PI = principal islet. (E) Scale bar = 50μm. (F) Scale bar = 15μm. (G-G') Projected substack within the pancreas of krt18:LifeActTom;Tp1:GFP larva at 6dpf. Scale bar = 15μm. (H-H'') Single z-plane of pancreas as in (G). Merged image (H) and corresponding single channel images (H', H'’). (I) Projection of confocal stack of 6 dpf krt18:LifeActTom larva, co-labeled with Phalloidin-488 (Phall-488, green). (J) Single slice merged image (top) and single channels (middle, bottom), of the region boxed in (I), showing actin labeling of apical membranes within the developing gut epithelium. Scale bar = 10μm. (K) krt18:LifeActTom labels intrapancreatic duct, shown is a projected z-stack, overlay with brightfield image. (L) Pancreatic expression of krt18:LifeActTom overlaps with actin-rich duct structures highlighted by Phall-488. Merged image (L) and corresponding single channel images (L', L''). (M) 6 dpf krt18:LifeActTom larva labeled with anti-dsRed antibody and Phall-488, nuclei are labeled with DAPI. (M’) Same sample as in (M), immunostained to indicate localization of Phall-488 in relation to 2F11 antibody. (N, N', N'') Single channel, single z-plane images of the region indicated in M (white box). |
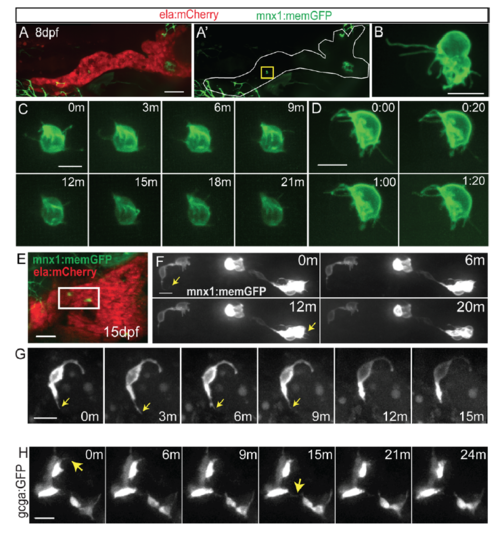
Protrusions in naturally occuring secondary islet cells. (A) Maximal projection of confocal stack of mnx1:memGFP;ela:mCherry transgenic at 8 dpf. mnx1:memGFP-positive cells are rare at this stage (see Table S1). (A') GFP signal shown alone for clarity, a single cell is indicated (yellow box). Scale bar = 50μm. This image was assembled by stitching together images of partially overlapping regions, using the Pairwise Stitching Plugin for ImageJ (Preibisch et al., 2009). (B) Close-up view of endocrine cells showing long protrusions, from larva as in (A). Scale bar = 10μm. (C, D) Time lapse series of cells as in sample (A), at the times indicated in minutes (C) and min:sec (D). Extension and retraction of fine protrusions can be observed. (E) At 15 dpf, mnx1:memGFP-positive cells are more frequently observed, and small clusters can be detected (white box). Scale bar = 50μm. (F) Time lapse series of cells from sample in (E), which display fine dynamic protrusions. Nonlinear gamma adjustment was applied to enhance weak signals of protrusions. Scale bar = 10μm. (G) Time lapse series of cell as in sample (E), at the times indicated in minutes (m). Arrow indicates protrusion. (H) Confocal projections from time lapse series of 7 dpf gcga:GFP transgenic that was treated with Notch inhibitor at 4 dpf. Nonlinear gamma adjustment was applied to enhance weak contrast signals. Arrows indicate dynamic protrusions. Scale bar = 10μm. |
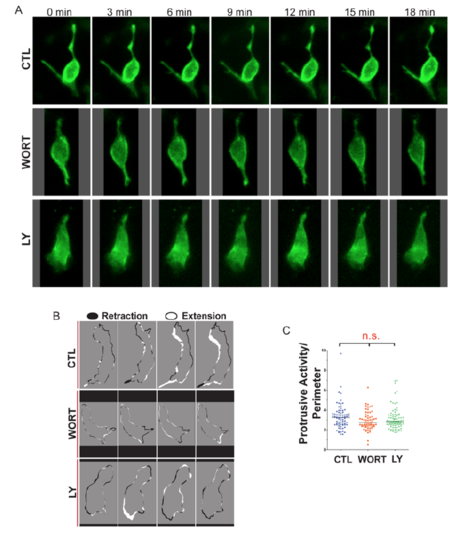
Single-cell analysis of endocrine cell dynamics. Related to Figure 5. (A) Time series of representative single cells, in mnx1:memGFP transgenics treated to induce secondary islets from 4-5 dpf, followed by treatment at 6 dpf as indicated (WORT, 100nM wortmannin, LY, 50μm Ly294002 or CTL, DMSO), for 3-4 hours prior to imaging. (B) Membrane protrusion analysis indicates regions of expansion (white) and retraction (black) around the cell perimeter between adjacent frames in time lapse series of control, WORT, and LY treated embryos, imaged as in (A). (C) Protrusive Activity (area of expansion + area of retraction) for each cell over time, analyzed as in (B), normalized to cell perimeter. (n.s., not significant; Kruskal-Wallis followed by Dunn’s Multiple Comparison test). |
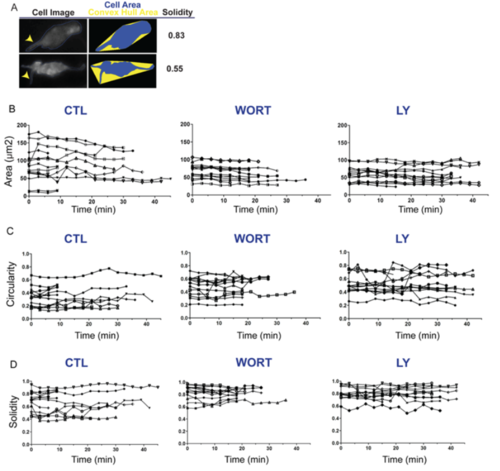
Single cell plots of cell morphology time series. Related to Figure 5. (A) Schematic illustration showing the impact of cell protrusions on the morphology parameter solidity. Broad protrusions (upper right, arrowhead) increase both cell and convex hull area. Narrow protrusions (lower right, arrowhead) increase convex hull area while minimally influencing cell area, thus more significantly impacting solidity as compared to broad protrusions. For cells treated and imaged as in Fig S8A, parameters of area (B), circularity (C), and solidity (D) plotted for each cell versus time (x-axis), under control (left), WORT treated (center), and Ly294002 treated (right) conditions. |
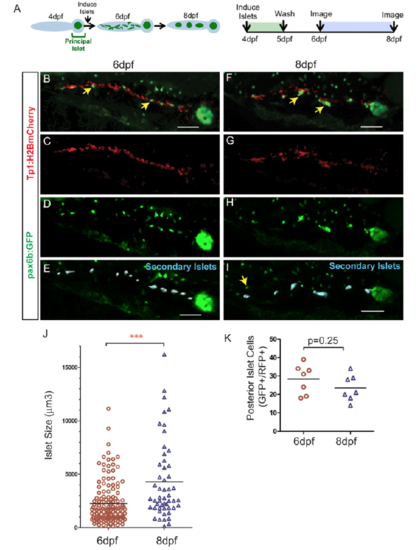
Quantitative assessment of islet assembly. (A) Schematic illustration of the progression of islet assembly (left) and experimental design (right). (B-I) 3D-projections of pax6b:GFP;Tp1:H2BmCherry larva generated using Imaris. Dispersed mCherry+/GFP+-cells at 6 dpf (B, arrows, D-E) and clusters at 8 dpf (F, arrows, H,I). (E, I) Secondary islets in the posterior pancreas (blue surfaces), identified using Imaris. Nearby GFP+/mCherry- cells (I, arrow) belong to the gut enteroendocrine system. Scale bar = 50μm. (J) Volumes of secondary islets, as analyzed using Imaris (blue surfaces in E, I), at 6 dpf (n=7) and 8 dpf (n=7) (p<0.0001, Mann-Whitney test, one-tailed). (K) GFP+/ H2BmCherry+ cells at 6 dpf and 8 dpf in samples as in (B) and (F) (p=0.25, t-test, two-tailed). The same samples were imaged at 6 dpf and 8 dpf (n=7). Results of all analyses are representative of 2 independent experiments. |
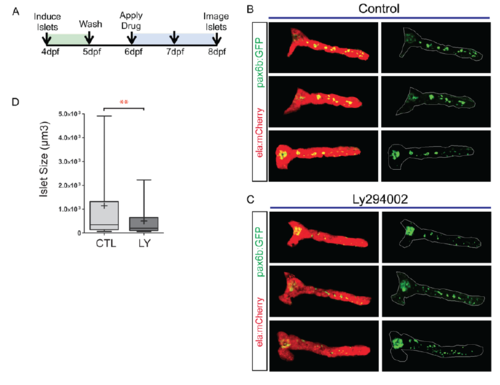
Image analysis to assess islet assembly. Related to Figure 6. (A) Experiment design for pharmacological modulation of islet assembly. (B, C) Image analysis for quantitation of secondary islet size in pax6b:GFP;ela:mCherry larvae showing a subset of controls (B) and Ly294002-treated samples (C). Images were obtained on a Leica Sp5 and ImageJ was used for image processing (For details, see Supplementary Methods). Shown is a projection of pancreas with external signals removed (left). GFP signal alone representing endocrine pancreas (right). (D) Quantitation of secondary islet size in pax6b:GFP;ela:mCherry larvae following treatment from 6 dpf to 8 dpf with 15μM Ly294002 (LY), versus controls (CTL). Samples were imaged on a Leica Sp5 and analyzed with ImageJ Particle Analyser (minimum object size 50μm3). **p<0.01, Mann-Whitney Test (onetailed).( CTL, n=10 larvae, 133 objects, LY, n=8 larvae, 80 objects.) |
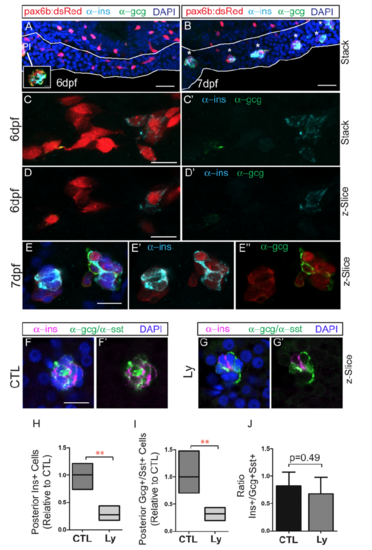
Expression of endocrine hormones in induced secondary islets. Immunohistochemistry of pax6:dsRed larvae at 6 dpf (A, C, D) and 7 dpf (B, E) treated to induce secondary islets, labeled with anti-dsRed (red), anti-ins (cyan) and anti-gcg (green) antibodies. Pancreas is outlined in white (A,B). Inset in (A, white box), single z-plane view of principal islet (PI) shows robust staining with anti-ins and anti-gcg. (A,B) Scale bar = 25μm (C-E) Scale bar = 10μm. (F,G) Endocrine hormone expression detected by antibody staining at 8 dpf, following islet induction in controls (CTL) and Ly294002-treated (LY) samples. Nuclei are counterstained with DAPI. Scale bar = 10μm. (H), (I) Relative numbers of cells from samples as in (F,G), expressing Ins (H) and Gcg (I), as compared to controls. Box plot graphs maximum to minimum, line at mean, n=4 per group, **p <0.01 (t-test). (J) Ratio of ins to gcg/sst expressing cells, plotted is the mean ± S.D. |
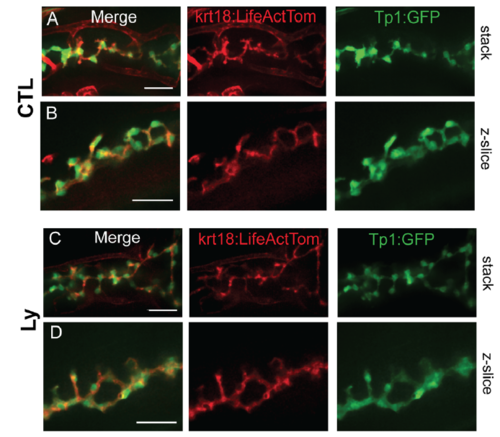
PI3K inhibition does not alter duct morphology. Live-imaging of krt18:LiveActTom;Tp1:GFP transgenics at 7dpf, in controls (CTL, A,B) and following treatment with 15μM Ly294002 from 6 dpf to 7 dpf (Ly, C,D). (A, C) Confocal projections of image stack. (B, D) Single z-plane close-up views. Scale bar = 25μm. |
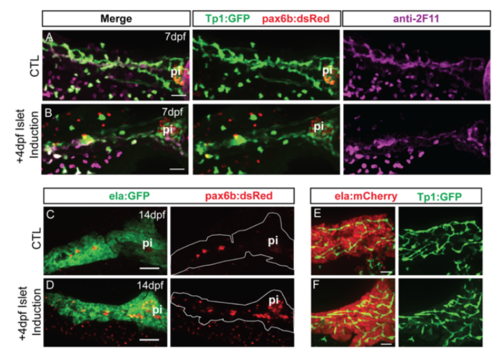
Islet induction transiently affects duct morphology. (A, B) Confocal image stacks of pancreas at 7 dpf from control and islet-induced samples transgenic for Tp1:GFP and pax6:dsRed. Samples were immunostained with anti-GFP and anti-2F11. Scale bar = 25μm. (C, D) Confocal image stacks of pancreas at 14 dpf from control and islet-induced samples transgenic for ela:GFP and pax6:dsRed, immunostained with anti-dsRed. Scale bar = 100μm. (E, F) Confocal image stacks of pancreas at 14 dpf of representative control and islet-induced samples transgenic for ela:mCherry and Tp1:GFP, immunostained with anti-GFP. Scale bar = 25μm. pi, principal islet. |
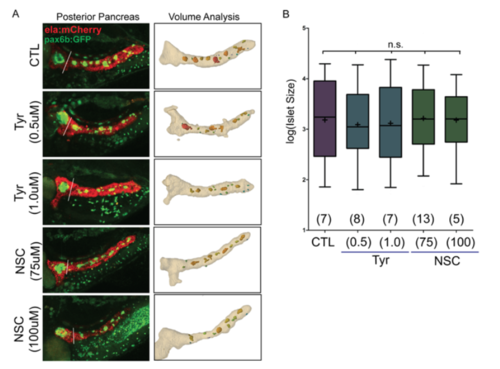
Impact of EGFR and Rac1 inhibition on islet assembly. (A) Representative images from islet assembly assay and analysis (as in Fig. 6B), showing automated detection of secondary islets in control (DMSO-treated) samples and larva treated with EGFR inhibitor (Tyr) and Rac1 inhibitor (NSC) at the indicated concentrations. (B) Quantitation of secondary islets using the automated method, graphed after log transformation to display the full range of values. Boxes extends from the 25th to 75th percentile, whiskers indicate 5th and 95th percentile, line indicates the median, mean is indicated by '+'. Islet volumes in treated samples are not significantly different from DMSOtreated controls. (p=0.6599, ANOVA followed by Dunnett’s Multiple Comparison Test). Number of larvae per group as indicated. CTL, 111 objects; Tyr (0.5μM), 115 objects; Tyr (1.0μM), 93 objects; NCS(75μM), 153 objects; NCS(100μM), 55 objects. |
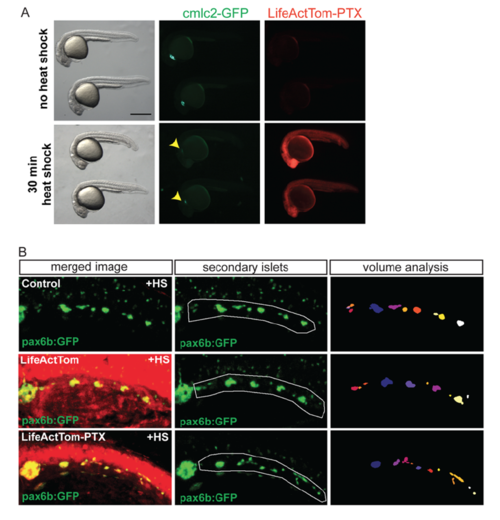
Heat shock induction of PTX expression impacts islet assembly. Related to Figure 7. (A) hsp70:LiveActTom-PTX embryos untreated (top), or heat shocked for 30 minutes at 50% epiboly (bottom), examined at 24 hpf. Induction of PTX leads to reduced body axis length (left) and perturbed cardiac development, as evidenced by reduced cmlc2:GFP expression (center). LifeActTom, and by inference PTX, is ubiquitously induced following a heat shock (right). (B) Representative images of transgene expression in larvae quantitated in (7C), transgenic for pax6b:GFP alone (top), or pax6b:GFP in combination with hsp70:LifeActTom (middle) or hsp70:LifeActTom-PTX (bottom). Green channel alone (pax6b:GFP), posterior islets subjected to quantitative analysis are outlined (center, white line). Projection of 3D objects as identified by ImageJ plugin Particle Analyser (right). |
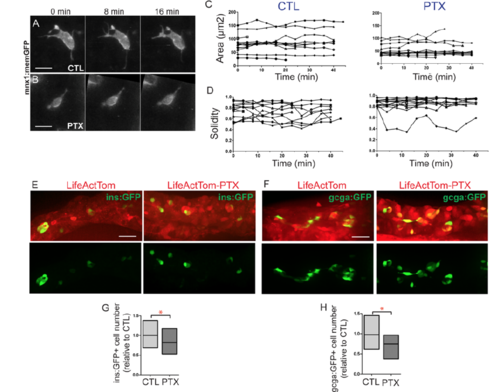
PTX expression impacts cell morphology. Related to Figure 7. (A, B) Selected confocal projections, containing single cells, from time lapse series of control (A, CTL) and PTX expressing (B, PTX) transgenic larvae at 7 dpf, 4 or more hours following a heat shock. (C, D) For treated cells as in (A) and (B), morphology parameters of area (C), and solidity (D) plotted for each cell versus time (x-axis). (Samples as analyzed in Fig. 7F, G, Table S5 contains details of cells analyzed.) (E, F) Hormone-positive cells indicated by expression of ins:GFP (E) and gcga:GFP (F) transgenes in LifeActTom-expressing control, and LifeActTom-PTX induced samples, treated as in Fig. 7B. (G, H) Quantitation of cell number, expressed in relation to the controls. Box plot graphs maximum to minimum, line at mean. *p<0.05, t-test. (G) CTL, n=26; PTX, n=11; (H) CTL, n=12; PTX, n=12. Samples are combined from 2 independent experiments. |