
|
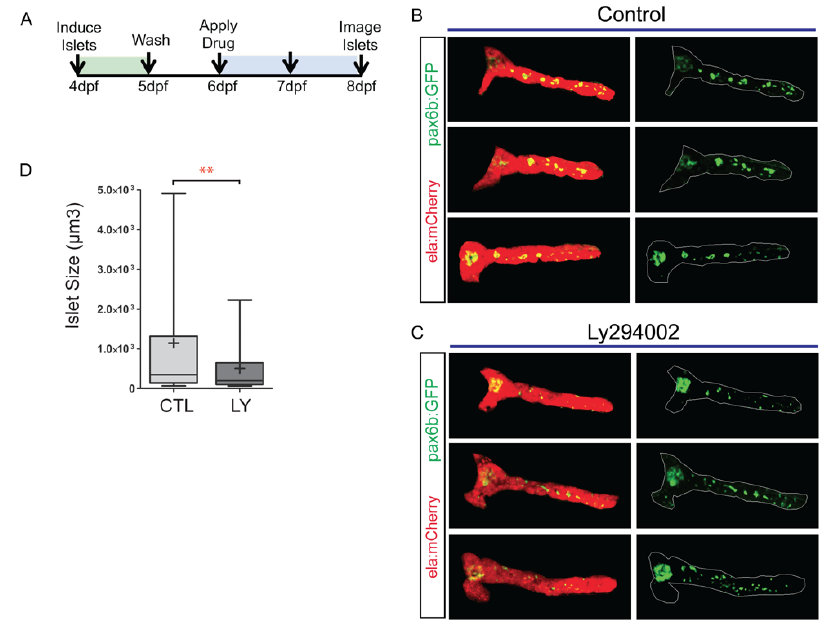
Fig. S10
Image analysis to assess islet assembly. Related to Figure 6.
(A) Experiment design for pharmacological modulation of islet assembly. (B, C) Image analysis for quantitation of secondary islet size in pax6b:GFP;ela:mCherry larvae showing a subset of controls (B) and Ly294002-treated samples (C). Images were obtained on a Leica Sp5 and ImageJ was used for image processing (For details, see Supplementary Methods). Shown is a projection of pancreas with external signals removed (left). GFP signal alone representing endocrine pancreas (right). (D) Quantitation of secondary islet size in pax6b:GFP;ela:mCherry larvae following treatment from 6 dpf to 8 dpf with 15μM Ly294002 (LY), versus controls (CTL). Samples were imaged on a Leica Sp5 and analyzed with ImageJ Particle Analyser (minimum object size 50μm3). **p<0.01, Mann-Whitney Test (onetailed).( CTL, n=10 larvae, 133 objects, LY, n=8 larvae, 80 objects.)