
|
Fig. S11
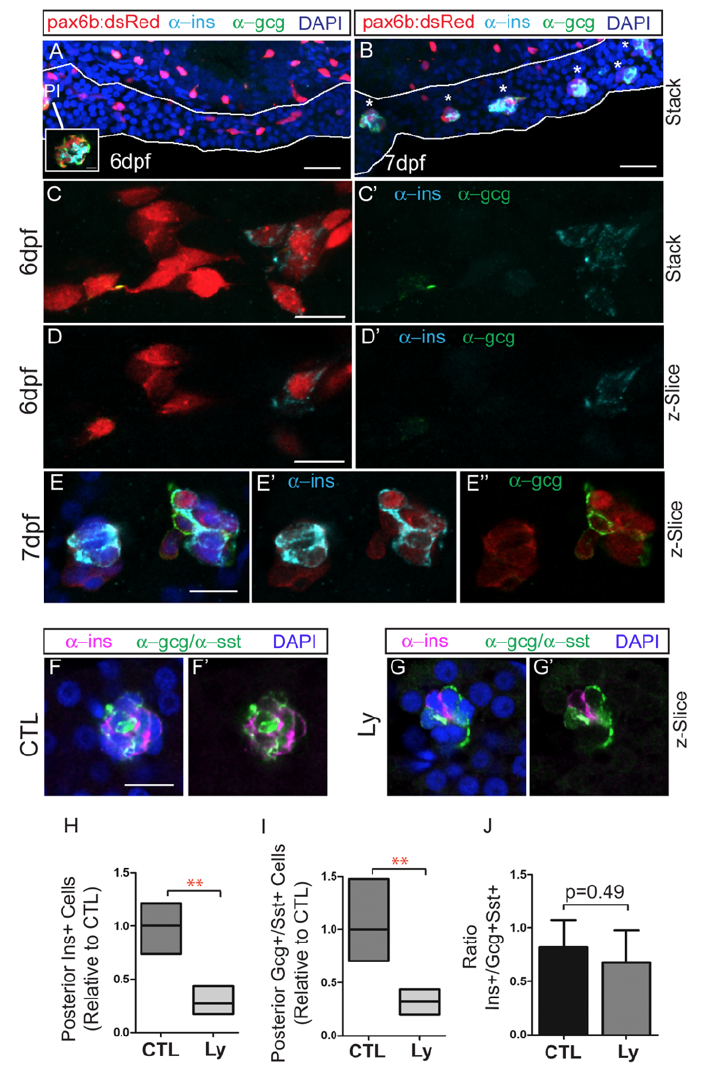
Expression of endocrine hormones in induced secondary islets.
Immunohistochemistry of pax6:dsRed larvae at 6 dpf (A, C, D) and 7 dpf (B, E) treated to induce secondary islets, labeled with anti-dsRed (red), anti-ins (cyan) and anti-gcg (green) antibodies. Pancreas is outlined in white (A,B). Inset in (A, white box), single z-plane view of principal islet (PI) shows robust staining with anti-ins and anti-gcg. (A,B) Scale bar = 25μm (C-E) Scale bar = 10μm. (F,G) Endocrine hormone expression detected by antibody staining at 8 dpf, following islet induction in controls (CTL) and Ly294002-treated (LY) samples. Nuclei are counterstained with DAPI. Scale bar = 10μm. (H), (I) Relative numbers of cells from samples as in (F,G), expressing Ins (H) and Gcg (I), as compared to controls. Box plot graphs maximum to minimum, line at mean, n=4 per group, **p <0.01 (t-test). (J) Ratio of ins to gcg/sst expressing cells, plotted is the mean ± S.D.