
|
Fig. S7
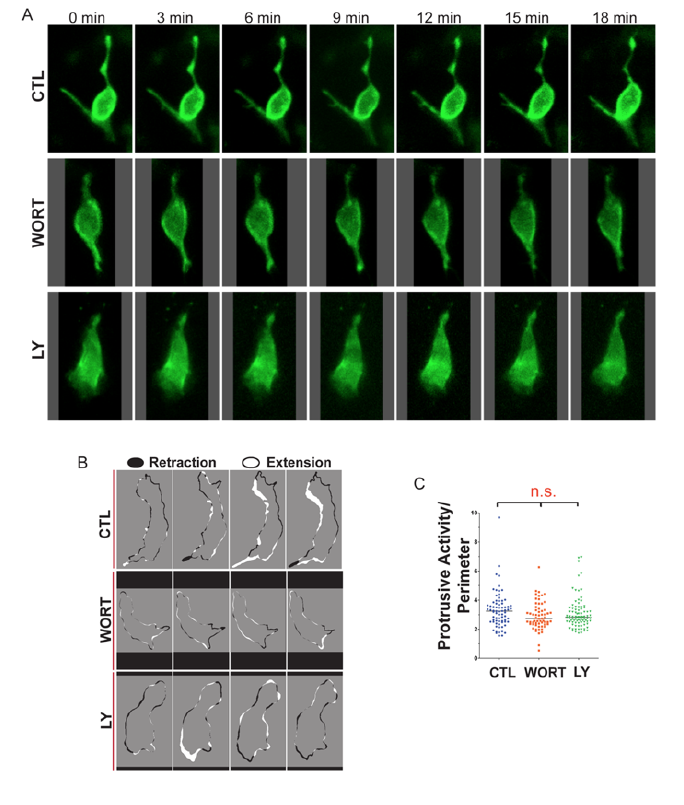
Single-cell analysis of endocrine cell dynamics. Related to Figure 5.
(A) Time series of representative single cells, in mnx1:memGFP transgenics treated to induce secondary islets from 4-5 dpf, followed by treatment at 6 dpf as indicated (WORT, 100nM wortmannin, LY, 50μm Ly294002 or CTL, DMSO), for 3-4 hours prior to imaging. (B) Membrane protrusion analysis indicates regions of expansion (white) and retraction (black) around the cell perimeter between adjacent frames in time lapse series of control, WORT, and LY treated embryos, imaged as in (A). (C) Protrusive Activity (area of expansion + area of retraction) for each cell over time, analyzed as in (B), normalized to cell perimeter. (n.s., not significant; Kruskal-Wallis followed by Dunn’s Multiple Comparison test).