
|
Fig. S14
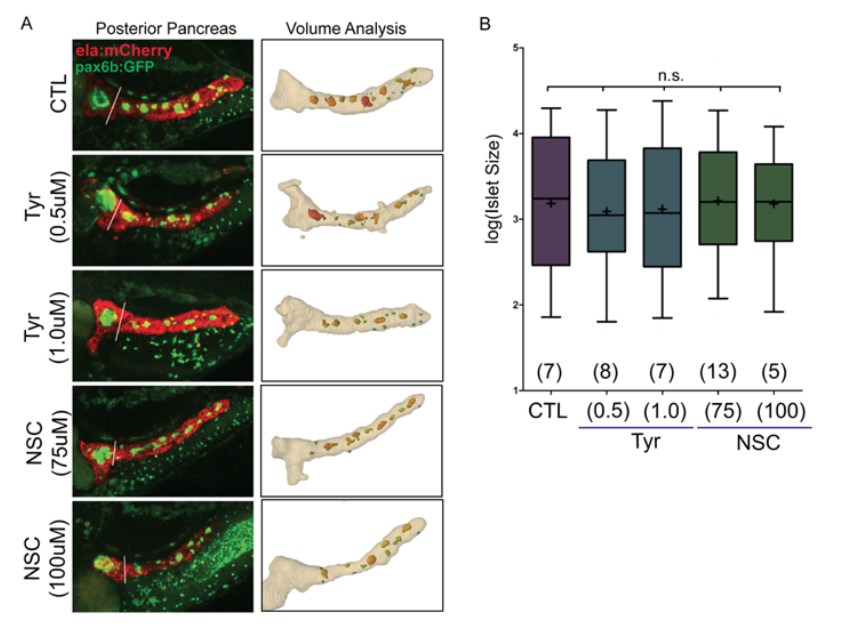
Impact of EGFR and Rac1 inhibition on islet assembly.
(A) Representative images from islet assembly assay and analysis (as in Fig. 6B), showing automated detection of secondary islets in control (DMSO-treated) samples and larva treated with EGFR inhibitor (Tyr) and Rac1 inhibitor (NSC) at the indicated concentrations. (B) Quantitation of secondary islets using the automated method, graphed after log transformation to display the full range of values. Boxes extends from the 25th to 75th percentile, whiskers indicate 5th and 95th percentile, line indicates the median, mean is indicated by '+'. Islet volumes in treated samples are not significantly different from DMSOtreated controls. (p=0.6599, ANOVA followed by Dunnett’s Multiple Comparison Test). Number of larvae per group as indicated. CTL, 111 objects; Tyr (0.5μM), 115 objects; Tyr (1.0μM), 93 objects; NCS(75μM), 153 objects; NCS(100μM), 55 objects.