
Image
|
Figure Caption
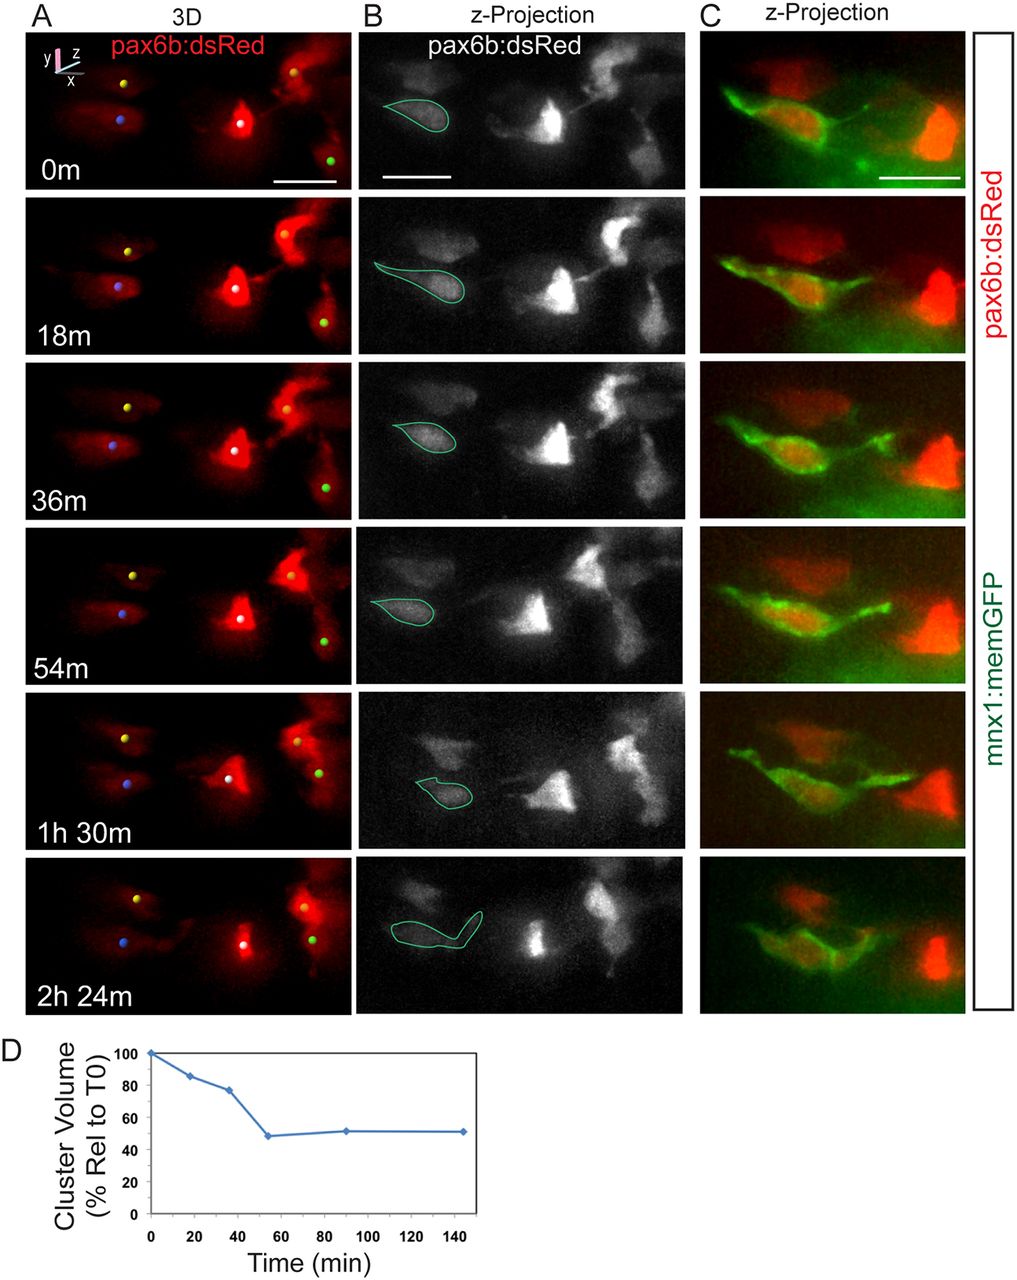
Fig. 3
Dynamics of cell coalescence. (A) Confocal time-lapse series of Notch inhibitor-treated pax6b:dsRed; mnx1:memGFP transgenic at 7 dpf showing coalescence of two cells (orange and green spheres). Three additional cells are tracked. (B) z-projections corresponding to the images in A, with RFP rendered in gray. (C) Two-channel, close-up view of the GFP+ cell outlined in B (green). A subset of images from a series collected at 18 min intervals are shown. Scale bars: 10 µm. (D) Quantitation of clustering (as in Fig. 2D) for the tracked cells indicated in A.
Acknowledgments
This image is the copyrighted work of the attributed author or publisher, and
ZFIN has permission only to display this image to its users.
Additional permissions should be obtained from the applicable author or publisher of the image.
Full text @ Development