
|
Fig. S9
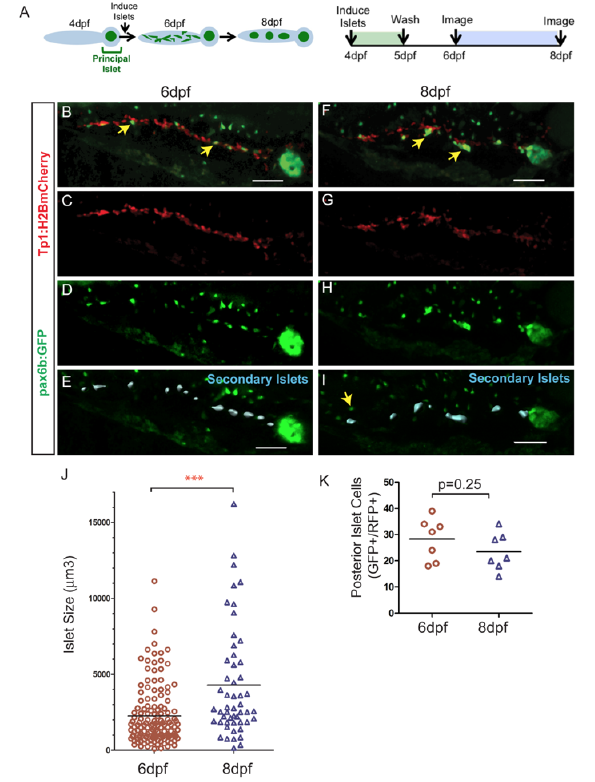
Quantitative assessment of islet assembly.
(A) Schematic illustration of the progression of islet assembly (left) and experimental design (right). (B-I) 3D-projections of pax6b:GFP;Tp1:H2BmCherry larva generated using Imaris. Dispersed mCherry+/GFP+-cells at 6 dpf (B, arrows, D-E) and clusters at 8 dpf (F, arrows, H,I). (E, I) Secondary islets in the posterior pancreas (blue surfaces), identified using Imaris. Nearby GFP+/mCherry- cells (I, arrow) belong to the gut enteroendocrine system. Scale bar = 50μm. (J) Volumes of secondary islets, as analyzed using Imaris (blue surfaces in E, I), at 6 dpf (n=7) and 8 dpf (n=7) (p<0.0001, Mann-Whitney test, one-tailed). (K) GFP+/ H2BmCherry+ cells at 6 dpf and 8 dpf in samples as in (B) and (F) (p=0.25, t-test, two-tailed). The same samples were imaged at 6 dpf and 8 dpf (n=7). Results of all analyses are representative of 2 independent experiments.