
|
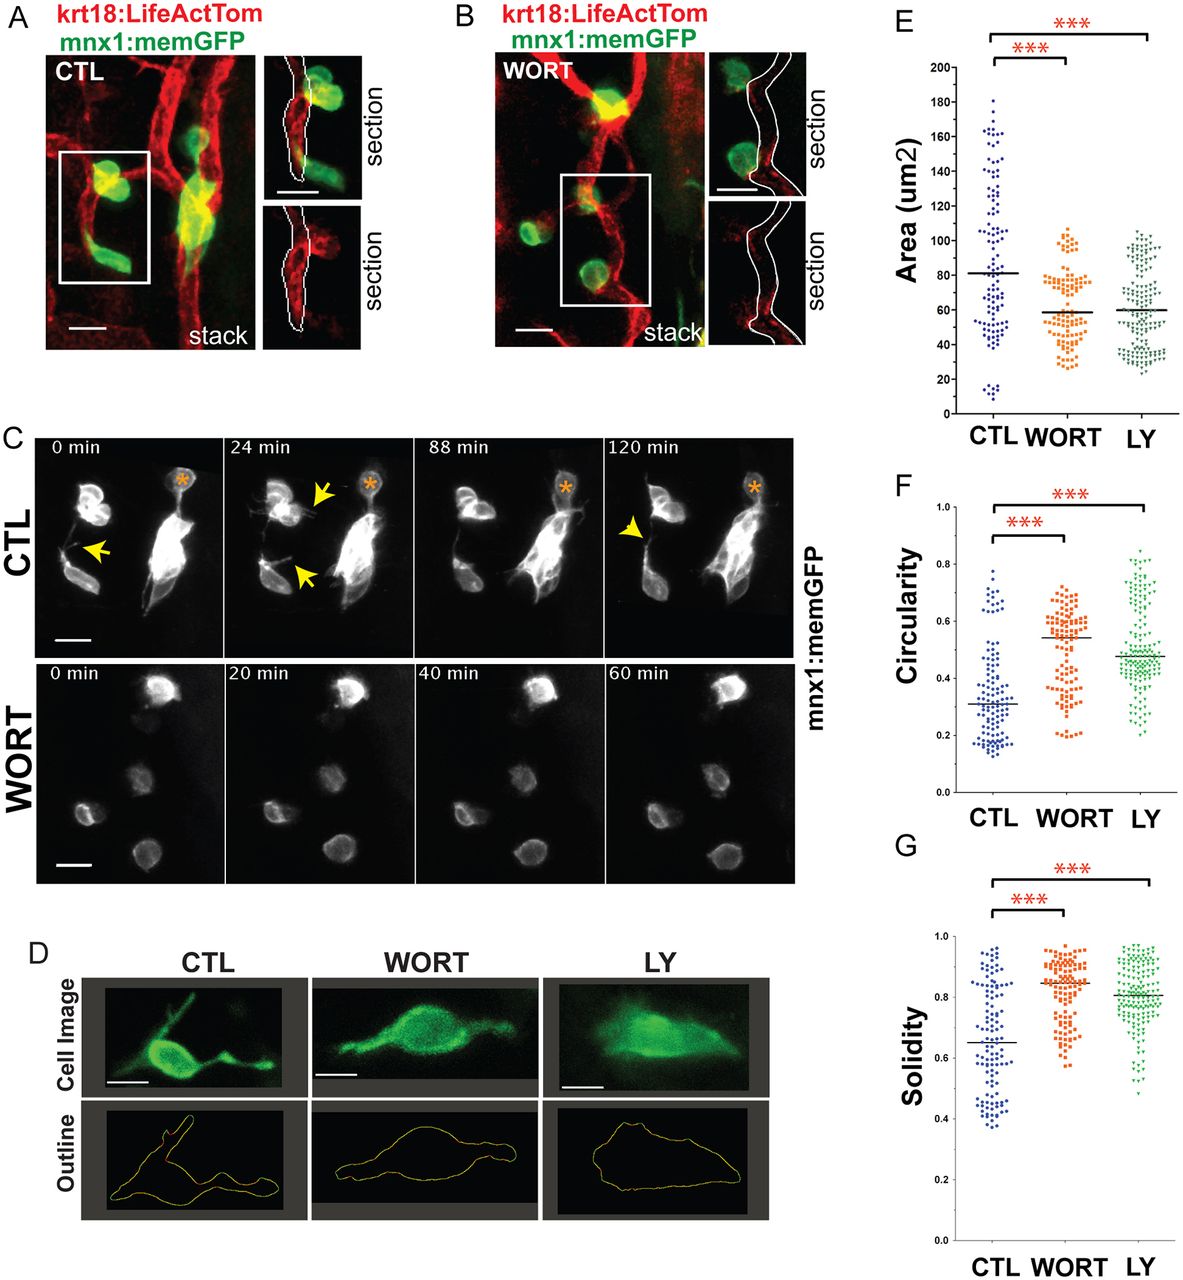
Fig. 5
PI3K inhibition impacts cell morphologies and dynamics. (A,B) (Left) Maximum intensity projections of confocal image stacks of early beta cells in (A) control (CTL) and (B) Wortmannin-treated (WORT) 7 dpf krt18:LifeActTom;mnx1:memGFP transgenics following islet induction at 4 dpf. (Right) Single z-planes from the boxed regions of the image stack (top, merge; bottom, single channel, LifeActTom) with the duct indicated (white outline). (C) Selected time points from time-lapse image series of samples from A and B. Arrows indicate protrusions. Asterisk indicates a cell that moves closer to the cluster. (D) Single images from time-lapse series, showing individual nascent beta cells in mnx1:memGFP transgenics treated to induce secondary islets from 4-5 dpf, followed by treatment at 6 dpf as indicated (WORT, 100 nM Wortmannin; LY, 50 µm Ly294002; CTL, DMSO), for 3-4 h prior to imaging (top row). The lower panels show the cell outline used for quantitative morphology analysis. (E-G) Cell area (E), circularity (F) and solidity (G) measured in individual frames of time-lapse series (see Fig. S3). ***P<0.0001, one-way ANOVA with Dunnett's post-test. CTL, 14 embryos, 118 time points; WORT, 14 embryos, 111 time points; LY, 13 embryos, 162 time points. Additional sample information is provided in Table S4. Scale bars: 10 µm in A-C; 5 µm in D.