
|
Fig. S1
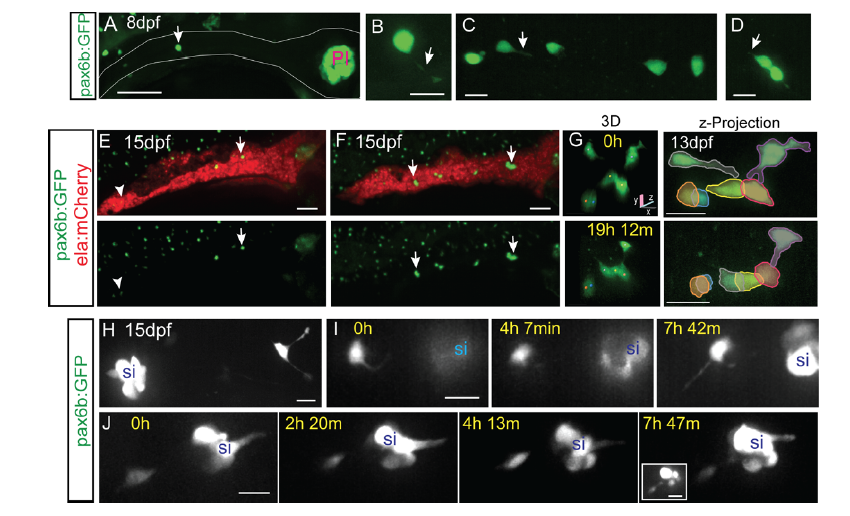
Morphology and dynamics of naturally occurring secondary islet cells. Related to figure 1.
(A) Maximal projection of confocal stack of pax6b:dsRed transgenic at 8 dpf. Scale bar = 50μm. (B) Close-up view of endocrine cell (in A, arrow), which displays a long protrusion (B, arrow). (C, D) Close-up views of secondary endocrine cells in samples as in A. Arrows indicate cell protrusions. (B-D) Scale bars = 10μm. (E, F) Maximal projections of confocal stacks of pax6b:dsRed;ela:mCherry transgenic at 15 dpf. Larvae show variable islet development, ranging from small islets (arrow, E) and single cells (arrowhead, E), to larger clusters (arrows, F). Scale bar = 50μm. (G) Islet cells at times indicated in 13 dpf pax6b:GFP transgenic. 3D view (left) showing tracked cells (colored spheres), maximal projection (right) with cells pseudocolored to highlight cell movements. Single time point (H) and image series at times indicated (I-J) from 15 dpf pax6b:GFP transgenics. Single cells show protrusions (H, I) and move closer to existing secondary islets (I, J). Increasing contrast reveals cell protrusions (J, right, inset). PI, principal islet; si, secondary islet. (G-J) Scale bar = 10μm. (For sample details see Tables S1, S2, S3.)