
|
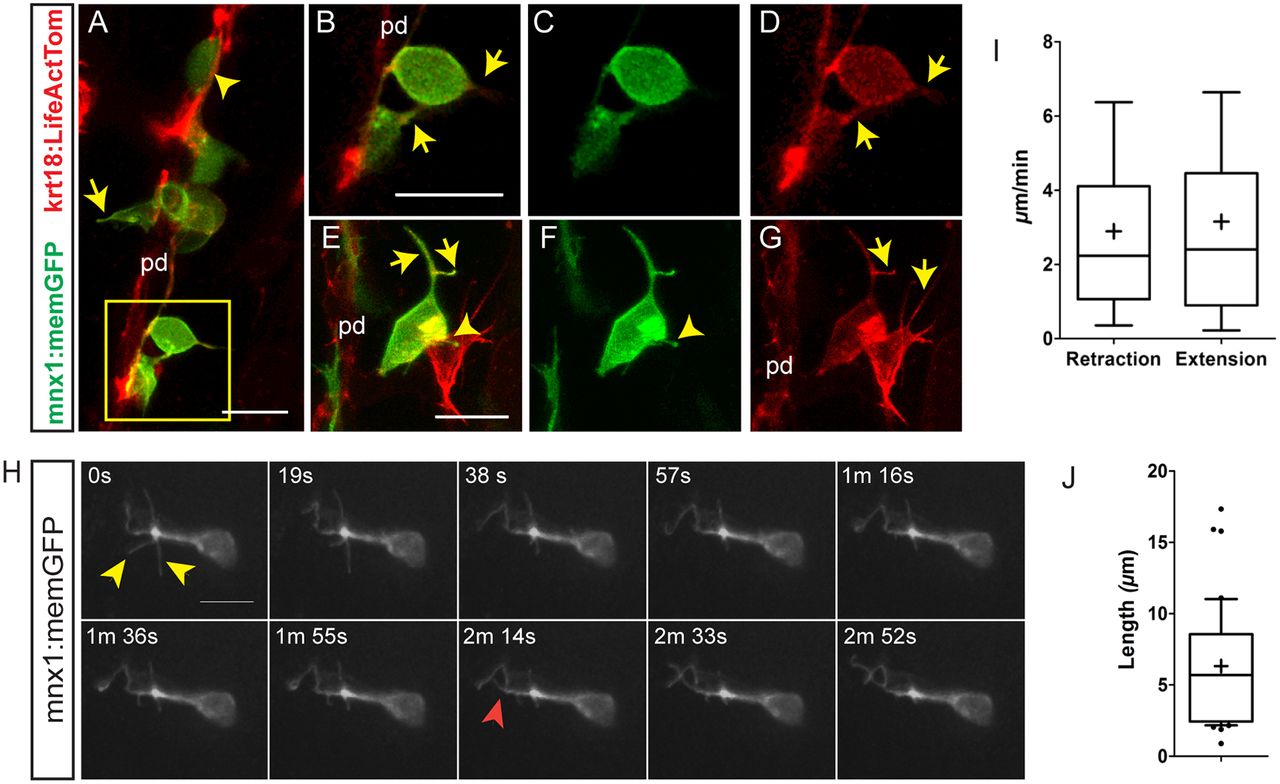
Fig. 4
Emerging endocrine cells extend protrusions. Confocal image stacks of differentiating pancreatic endocrine cells in living 6 dpf krt18:LifeActTom;mnx1:memGFP transgenics following Notch inhibitor treatment from 4 dpf to 5 dpf. Shown are maximum intensity projections (A,E-G) and single z-slices (B-D). pd, pancreatic duct. (A) A rounded GFP+/LifeActTom+ early beta cell found within the duct (arrowhead); the cell leaving the duct has a narrow protrusion (arrow). (B-D) Close-up of the boxed region from A, showing merged (B) and single channels (C,D). GFP+/LifeActTom+ early beta cells extend actin-rich processes (arrows). (E-G) Thin actin-rich processes (arrows) project and connect two LifeActTom+ cells (arrowhead) in close proximity to the duct. The GFP+ cell is a nascent beta cell, whereas the GFP− cell is likely to represent a differentiating non-beta endocrine cell. (H) Maximum intensity projections at the indicated time points of time-lapse series acquired by spinning disc microscopy of Notch inhibitor-treated larva analyzed at 6 dpf. Nonlinear gamma adjustment was applied to enhance low contrast signals. Dynamic extension (red arrowhead) and retraction (yellow arrowheads) of fine protrusions were detected. (I) Quantitation of instantaneous retraction and extension rates analyzed from images captured as in H. (J) Maximal filopodia lengths from image series as in H. In box-whisker plots, whiskers represent 10-90%, outliers are indicated by dots, and the mean is indicated by ‘+’. Sample details are provided in the supplementary Materials and Methods. Scale bars: 10 µm in A-H.