
|
Fig. S6
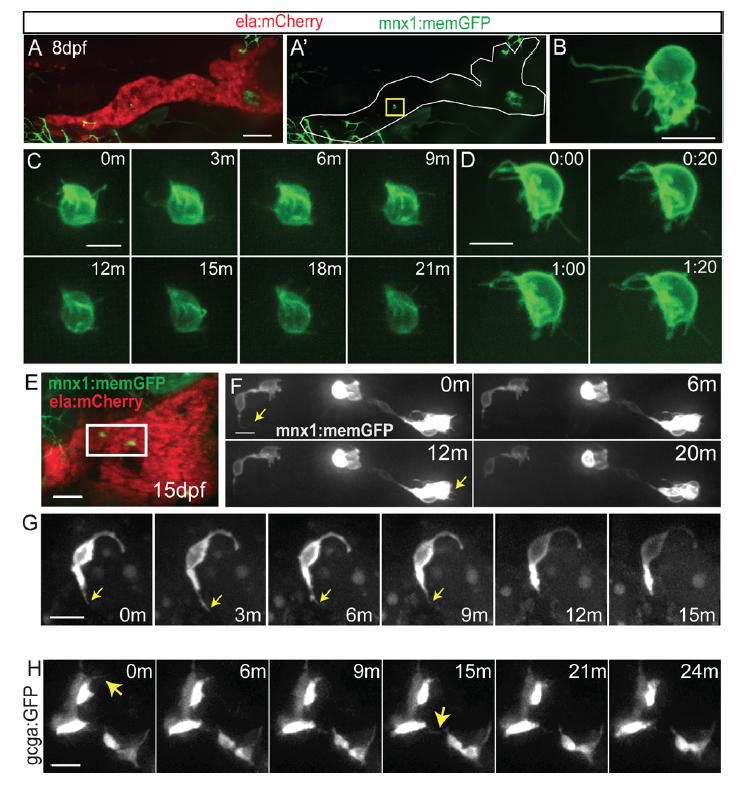
Protrusions in naturally occuring secondary islet cells.
(A) Maximal projection of confocal stack of mnx1:memGFP;ela:mCherry transgenic at 8 dpf. mnx1:memGFP-positive cells are rare at this stage (see Table S1). (A') GFP signal shown alone for clarity, a single cell is indicated (yellow box). Scale bar = 50μm. This image was assembled by stitching together images of partially overlapping regions, using the Pairwise Stitching Plugin for ImageJ (Preibisch et al., 2009). (B) Close-up view of endocrine cells showing long protrusions, from larva as in (A). Scale bar = 10μm. (C, D) Time lapse series of cells as in sample (A), at the times indicated in minutes (C) and min:sec (D). Extension and retraction of fine protrusions can be observed. (E) At 15 dpf, mnx1:memGFP-positive cells are more frequently observed, and small clusters can be detected (white box). Scale bar = 50μm. (F) Time lapse series of cells from sample in (E), which display fine dynamic protrusions. Nonlinear gamma adjustment was applied to enhance weak signals of protrusions. Scale bar = 10μm. (G) Time lapse series of cell as in sample (E), at the times indicated in minutes (m). Arrow indicates protrusion. (H) Confocal projections from time lapse series of 7 dpf gcga:GFP transgenic that was treated with Notch inhibitor at 4 dpf. Nonlinear gamma adjustment was applied to enhance weak contrast signals. Arrows indicate dynamic protrusions. Scale bar = 10μm.