
|
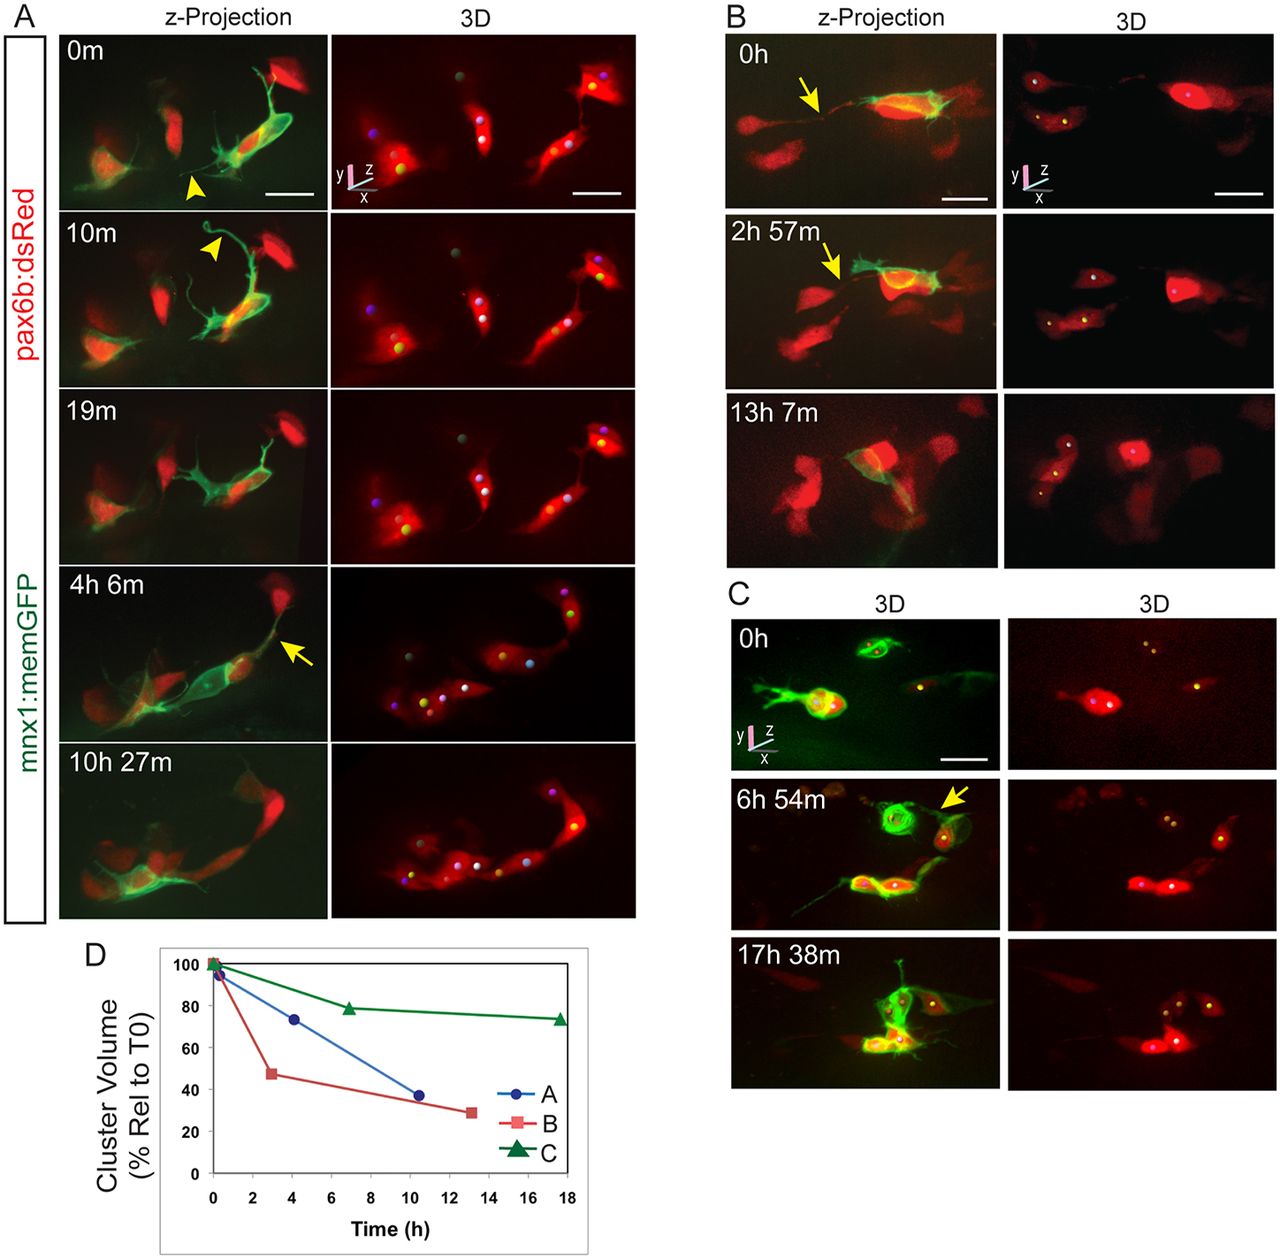
Fig. 2
Clustering endocrine cells extend dynamic protrusions. (A-C) Image series acquired by confocal microscopy showing pancreatic endocrine cells in pax6b:dsRed;mnx1:memGFP transgenics at 7 dpf, following Notch inhibitor treatment from 4 dpf to 5 dpf. Shown are maximum intensity projections (A,B, left) and 3D representations of tracked cells (colored spheres), rotated to best visualize individual cells (A,B, right, C). mnx1:memGFP transgene expression delineates dynamic protrusions (arrowheads). Arrows indicate fine cell-cell connections. (D) Progression of cell clustering over time. Clustering is quantitated as the volume of a convex 3D polygon enclosing the cell centers (see Fig. S3A), plotted against time for the samples shown in A-C. Volume decreases over time as cells come into closer proximity (for details see the supplementary Materials and Methods). Scale bars: 10 μm.