
|
Fig. 1
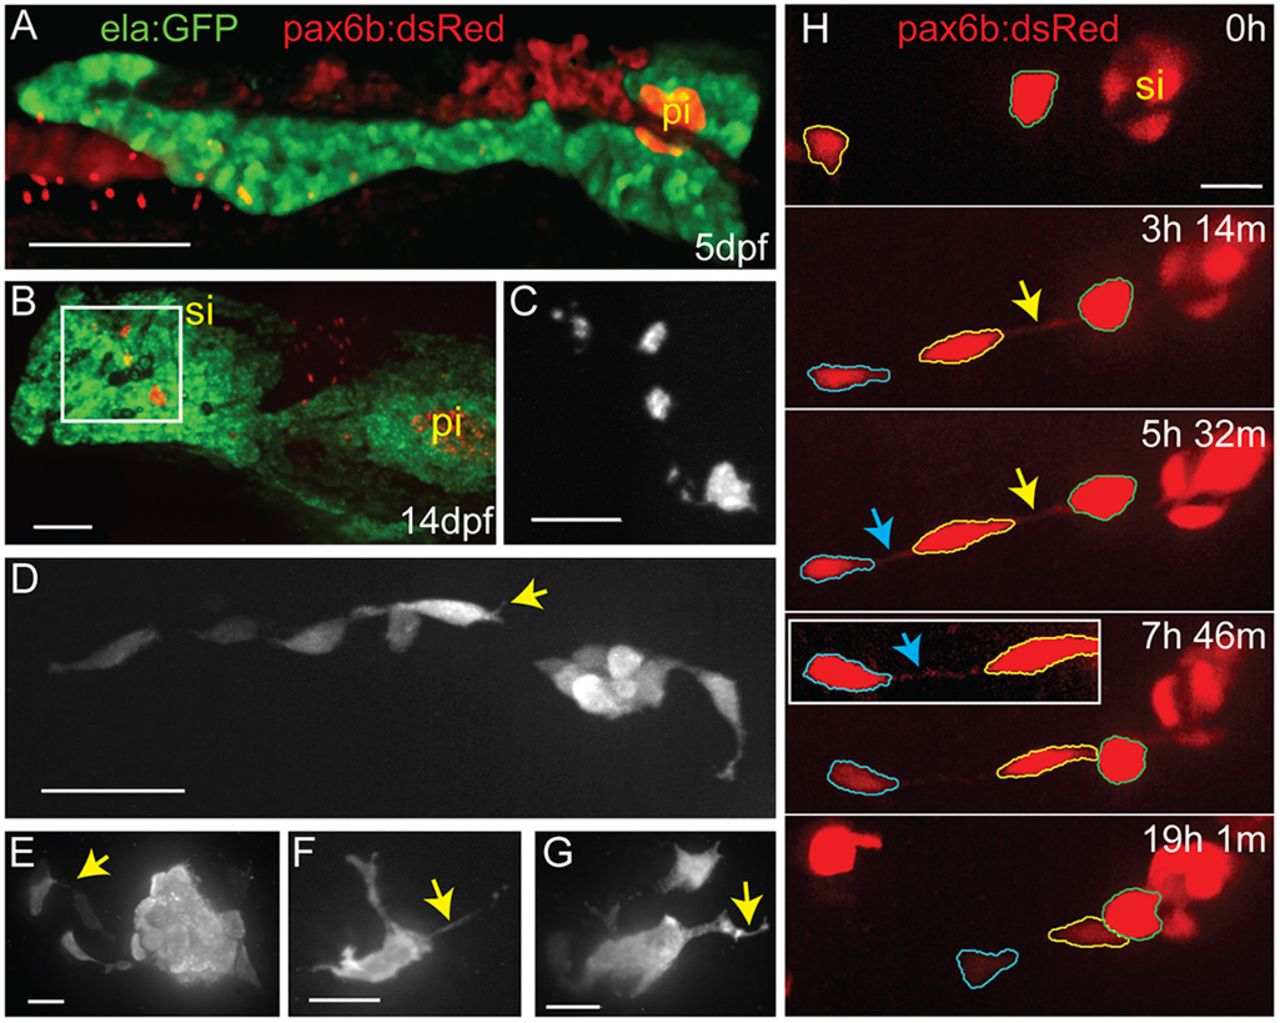
Endocrine cells display complex morphologies during secondary islet assembly. (A) Maximal projection of confocal stack of the pancreas at 5 dpf, imaged in a living zebrafish larva. Fluorescent transgenes label the exocrine (ela:GFP, green) and endocrine (pax6b:dsRed, red) compartments. (B) Maximal projection of confocal stack of fixed and microdissected pancreas from 14 dpf ela:GFP;pax6b:dsRed transgenic larva. This image was assembled by stitching together images of partially overlapping regions, using the Pairwise Stitching plug-in for ImageJ (Preibisch et al., 2009). pi, principal islet; si, secondary islet. (C) Close-up of pax6b:dsRed+ secondary islets (gray) from boxed region in B. (D-G) Confocal z-stack projections of secondary islet cells and clusters from samples as in B, showing pax6b:dsRed transgene expression (gray). Yellow arrows highlight cell protrusions. (H) Confocal image series (maximum projections) of endocrine cells in the posterior pancreas of a pax6b:dsRed transgenic larva beginning at 14 dpf, with subsequent images acquired at the times indicated (h, hours; m, minutes). Outlines (blue, yellow and green) indicate individual cells that move into closer proximity to each other and to a pre-existing secondary islet. Arrows indicate fine cell-cell connections. Inset, cell-cell connections become visible with contrast enhancement (blue arrow). Nonlinear gamma adjustment was applied to highlight fine protrusions and cell-cell connections. Scale bars: 100 µm in A,B; 50 µm in C; 25 µm in D; 10 µm in E-H;