
|
Fig. S5
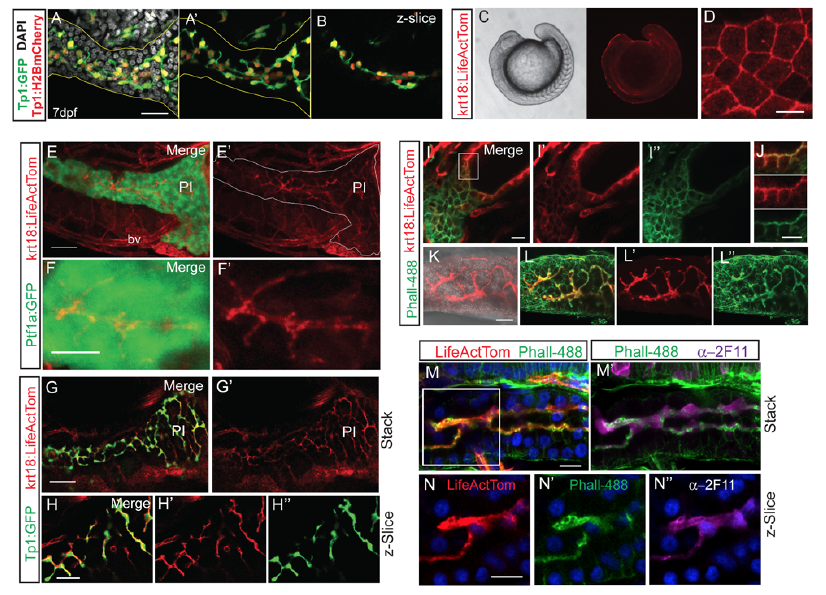
Pancreatic duct morphology delineated with krt18:LifeActTom transgene.
(A) Maximal projection of confocal z-stack showing pancreatic duct morphology at 7 dpf delineated by expression of Tp1:H2BmCherry (red, nuclear) and Tp1:GFP (green, cytoplasmic), immunostained for GFP. Nuclei (gray) are stained by DAPI. Pancreas is delineated by yellow outline. (A’) Image as in (A) with DAPI signal removed. (B) Single zslice of sample shown in (A). (C) Widefield view showing krt18:LifeActTom transgene expression in surface epithelium in 15-somite stage embryo (right), with corresponding brightfield view (left). (D) Maximum intensity projection of confocal stack of surface epithelium of embryo as in (C), showing actin accumulation at cell-cell junctions. Scale bar = 25μm. (E-F) Projection of confocal stack through the pancreas in krt18:LifeActTom;ptf1a:GFP larva at 6 dpf. (E'-F’) krt18:LifeActTom expression, with GFP channel removed. (E’) Pancreas as defined by ptf1a:GFP, is outlined in white. LifeActTom is also expressed in some blood vessels (bv). PI = principal islet. (E) Scale bar = 50μm. (F) Scale bar = 15μm. (G-G') Projected substack within the pancreas of krt18:LifeActTom;Tp1:GFP larva at 6dpf. Scale bar = 15μm. (H-H'') Single z-plane of pancreas as in (G). Merged image (H) and corresponding single channel images (H', H'’). (I) Projection of confocal stack of 6 dpf krt18:LifeActTom larva, co-labeled with Phalloidin-488 (Phall-488, green). (J) Single slice merged image (top) and single channels (middle, bottom), of the region boxed in (I), showing actin labeling of apical membranes within the developing gut epithelium. Scale bar = 10μm. (K) krt18:LifeActTom labels intrapancreatic duct, shown is a projected z-stack, overlay with brightfield image. (L) Pancreatic expression of krt18:LifeActTom overlaps with actin-rich duct structures highlighted by Phall-488. Merged image (L) and corresponding single channel images (L', L''). (M) 6 dpf krt18:LifeActTom larva labeled with anti-dsRed antibody and Phall-488, nuclei are labeled with DAPI. (M’) Same sample as in (M), immunostained to indicate localization of Phall-488 in relation to 2F11 antibody. (N, N', N'') Single channel, single z-plane images of the region indicated in M (white box).