
- Title
-
Single-cell RNA sequencing unravels the transcriptional network underlying zebrafish retina regeneration
- Authors
- Celotto, L., Rost, F., Machate, A., Bläsche, J., Dahl, A., Weber, A., Hans, S., Brand, M.
- Source
- Full text @ Elife
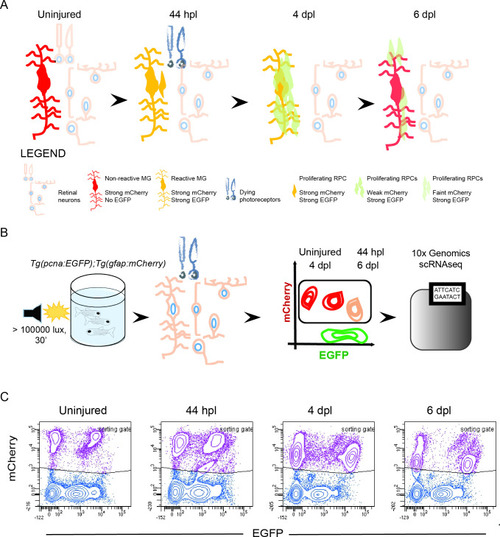
Isolation of individual MG, RPCs and regenerated progeny using fluorescent reporters. (A) Schematic illustration of the rationale to isolate individual cells from regenerating retinae of double transgenic Tg(pcna:EGFP);Tg(gfap:mCherry) animals. In the uninjured retina, MG express strong levels of mCherry but no EGFP. Upon light lesion, which results in dying photoreceptors, MG turn on EGFP resulting in the presence of both fluorophores at 44 hours post lesion (hpl). At 4 days post lesion (dpl), MG remain to contain strong mCherry and EGFP levels. In contrast, further proliferating RPCs display weak mCherry but strong EGFP fluorescence. Finally, MG have lost the EGFP signal at 6 dpl, expressing mCherry only. RPCs, which start to migrate and differentiate, are still detectable but show diluted levels of mCherry and EGFP. (B) Schematic illustration of the workflow for the scRNAseq experiment. Uninjured control and light lesioned retinae (44 hpl, 4 dpl, 6 dpl) of double transgenic Tg(pcna:EGFP);Tg(gfap:mCherry) animals were dissociated to obtain a single cell suspension. Following fluorescent activated cell sorting of mCherry-positive only and EGFP/mCherry-double positive cells, individual cells were eventually subjected to droplet-based, 10 x Genomics scRNAseq. (C) Flow cytometry plots depicting EGFP and mCherry fluorescence of dissociated retinal cells at the indicated time points. Cells in the sorting gate include mCherry-positive only as well as mCherry/EGFP-double positive cells. Number of cells sorted from the sorting gate per time point: 15,000. Associated: Figure 1—figure supplements 1–3. |
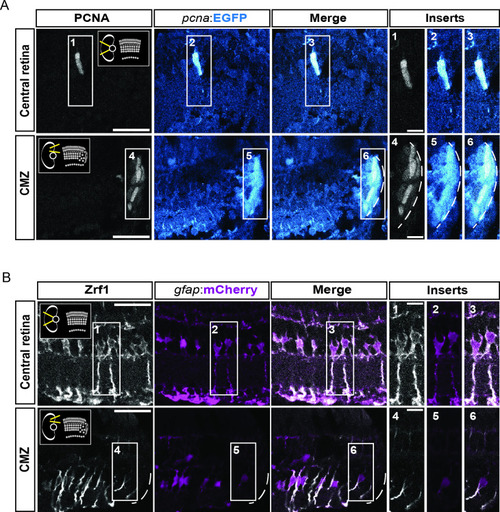
figure supplement 1.. characterization of the fluorescent reporter lines Tg(pcna:EGFP) and Tg(gfap:mCherry) in double transgenic animals. (A) Confocal images of immunohistochemistry against the proliferation marker PCNA (grey) and EGFP (blue) on retinal sections of Tg(pcna:EGFP);Tg(gfap:mCherry) animals. Schemes in the thumbnails on the top-right and top-left of the PCNA panels indicate the region of interest, either the central retina or the ciliary marginal zone (CMZ). N=3 fish. (B) Confocal images of immunohistochemistry detecting Zrf1-positive MG fibers (magenta) and mCherry on retinal sections of Tg(pcna:EGFP);Tg(gfap:mCherry) animals. N=3 fish. Scale bar: 30 µm for main panels, 10 µm for inserts. |
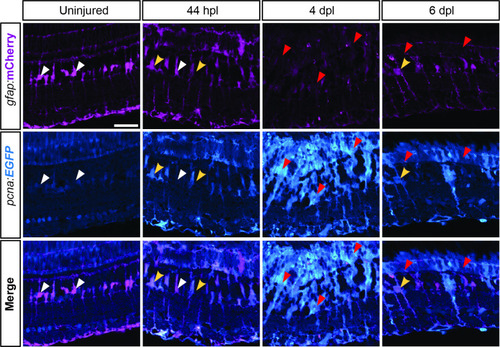
expression profile of Apotome images showing endogenous immunofluorescence of EGFP and mCherry driven by |
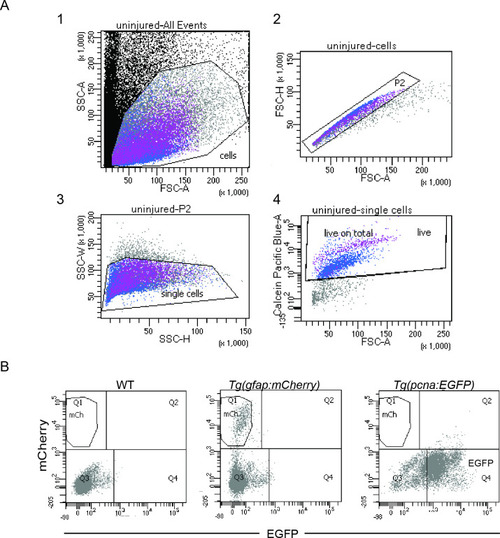
fluorescence activated cell sorting (FACS) and gating strategies. ( |
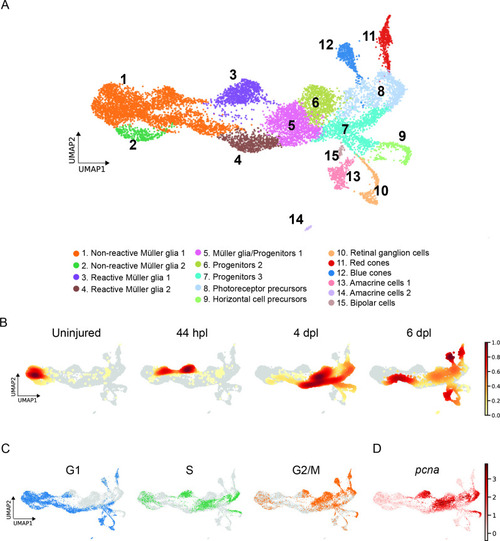
scRNAseq identifies 15 different cell populations in the light-lesioned retina. (A) A total of 11,690 cells depicted on the uniform manifold approximation and projection (UMAP) map. From left to right, the map shows a progressive emergence of MG, RPCs and progeny clusters. See figure legend for the detailed information about cluster identity. (B) Normalized cell density on the UMAP for the four different samples (uninjured, 44 hpl, 4 and 6 dpl). Dark red shows strong cell enrichment and no color absence of cells. (C) Cells colored by cell cycle phases (G1, S, and G2/M phase in blue, green and orange, respectively). (D) Expression of pcna. Legend: logarithm of normalized counts per million. Associated: Figure 2—figure supplements 1 and 2. |
Original scRNAseq dataset. ( |
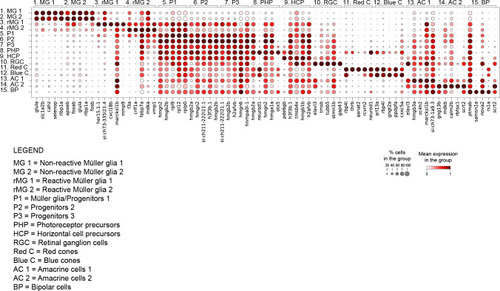
Dot plot of top 5 marker genes per cluster. Dot plot depicting the expression of top 5 marker genes per cluster (see |
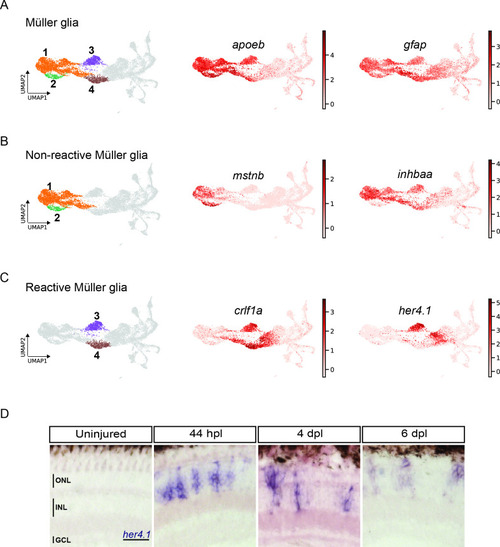
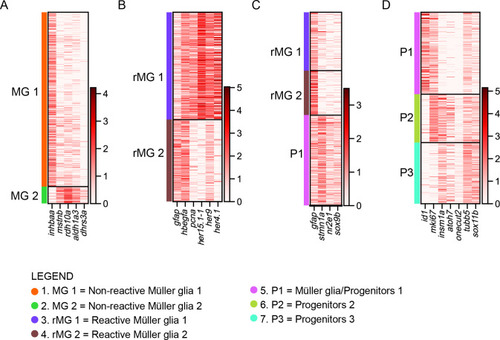
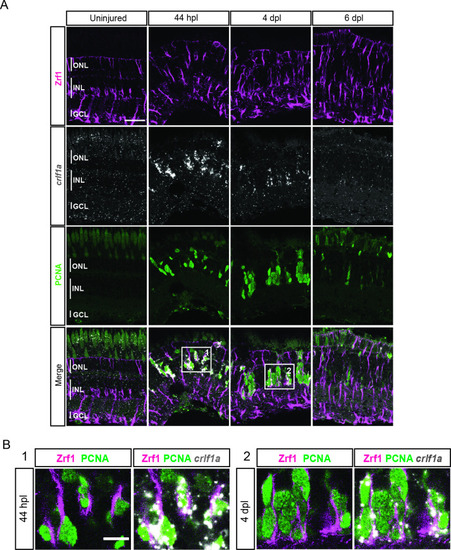
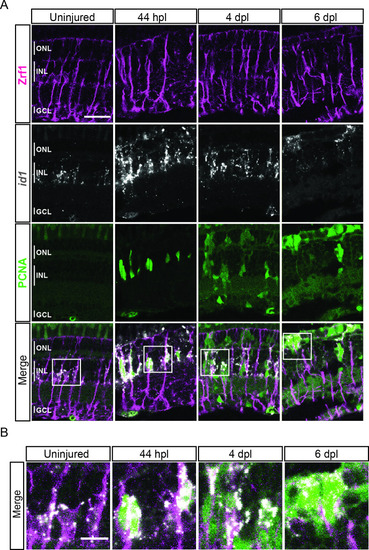
scRNAseq reveals heterogeneity in Müller glia and identifies two populations of non-reactive and two of reactive Müller glia in the light-lesioned retina. (A) Four Müller glia clusters (cluster 1–4) and the expression levels of apoeb and gfap. (B) The two non-reactive Müller glia clusters (cluster 1 and 2) and the expression levels of mstnb and inhbaa. Cells of both clusters express mstnb, but only cells in cluster 1 expresses inhbaa. (C) Visualization of the two reactive Müller glia clusters (cluster 3 and 4) and the relative expression levels of crlf1a and her4.1 projected onto the main transcriptional UMAP. Cells of both clusters express crlf1a, but only cells in cluster 3 expresses her4.1. (D) Bright field microscopy images of chromogenic in situ hybridization detecting her4.1 on retinal sections of uninjured control animals and at 44 hr post lesion (hpl), 4 days post lesion (dpl) and 6 dpl. N=3 fish per time point and uninjured controls. The position of the outer nuclear layer (ONL), inner nuclear layer (INL) and ganglion cell layer (GCL) is indicated in the uninjured sample. Scale bar: 30 µm. Associated: Figure 3—figure supplements 1 and 2. |
expression of selected genes per cluster. ( |
expression profile of ( |
expression profile of ( |
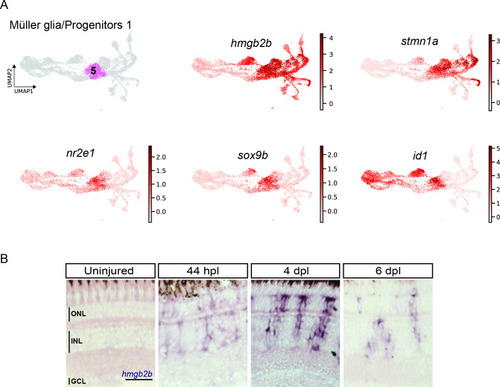
scRNAseq identifies a transient cell population with hybrid characteristics of reactive Müller glia and early progenitors in the light-lesioned retina. ( |
expression profile of ( |
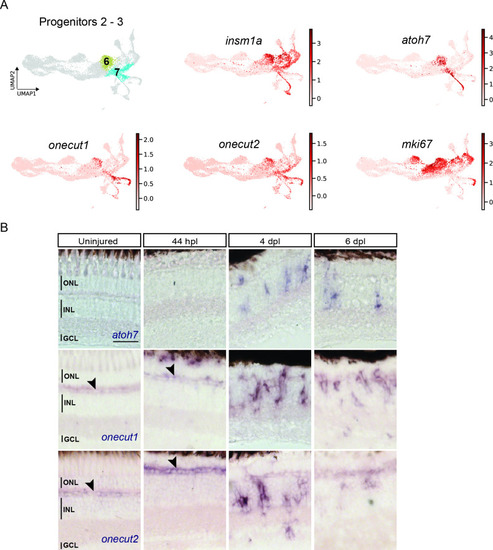
scRNAseq identifies two neurogenic progenitor populations in the light-lesioned retina. ( |
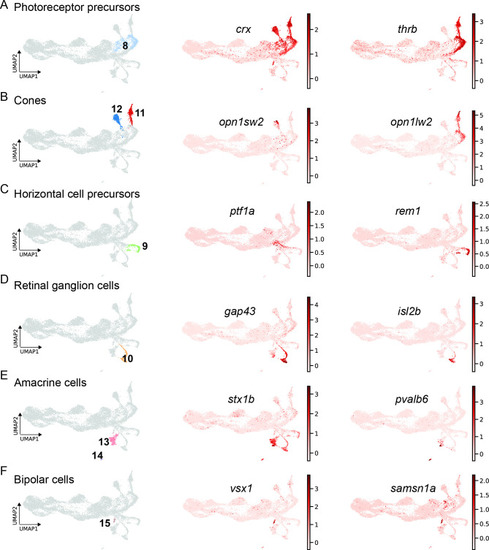
scRNAseq identifies fate-restricted progenitors and differentiating progeny in the light-lesioned retina. (A) The photoreceptor precursor cluster (cluster 8) and the expression levels of crx and thrb. (B) The red and blue cone cluster (clusters 11 and 12) and the expression levels of the blue cone marker opn1sw2 and red cone marker opn1lw2. (C) The horizontal cell precursor cluster (cluster 9) and the expression levels of ptf1a and rem1. (D) The ganglion cell cluster (cluster 10) and the expression levels of gap43 and isl2b. (E) The two amacrine cell clusters (clusters 14 and 15) and the expression levels of stx1b and pvalb6. (D) The bipolar cell cluster (cluster 15) and the expression levels of the known bipolar cell marker vsx1 and the novel marker samsn1a. Associated: Figure 8—figure supplements 1 and 2. |
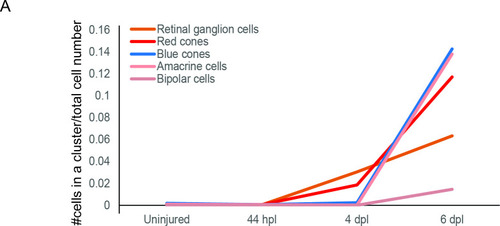
birthdate order of regenerated progeny. Graph plotting the fraction of cells (y-axis) embarking on a specific retinal cell fate (coloured curves) in relation to a given time point (x-axis). Total number of cells per condition: uninjured = 2243, 44 hpl = 1723, 4 dpl = 4899, 6 dpl = 2,825. |
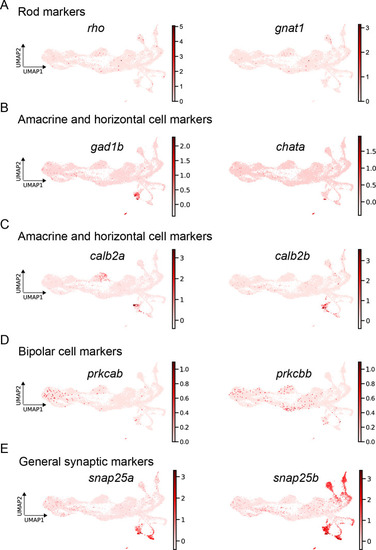
expression of mature markers. ( |
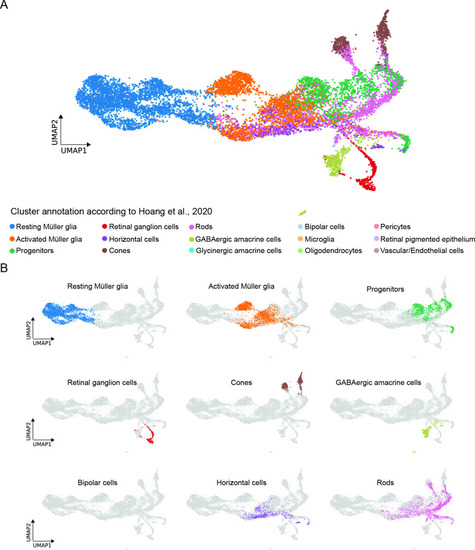
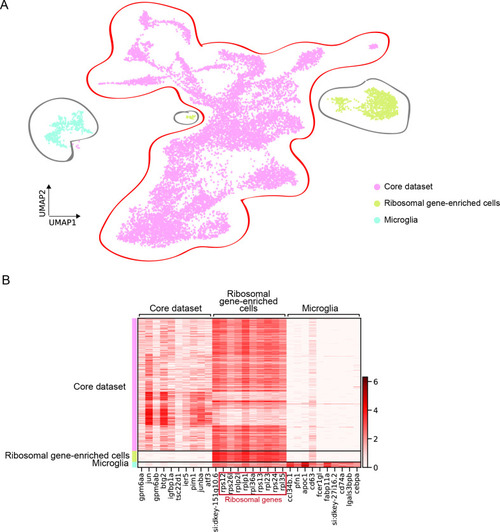
Comparison between the present scRNAseq dataset and the scRNAseq dataset by Hoang et al., 2020. (A) UMAP showing all cell clusters annotated in Hoang et al., 2020 and mapped to the scRNAseq dataset described in the present study. (B) UMAP showing the individual cell clusters annotated in Hoang et al., 2020 and mapped to the scRNAseq dataset described in the present study. |
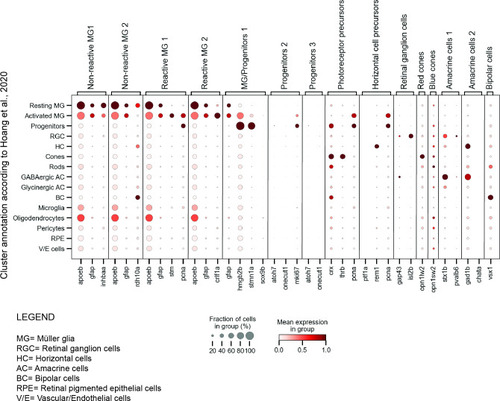
dot plot of selected marker genes per cluster in the present scRNAseq dataset and the scRNAseq dataset by Dot plot depicting the expression of our selected marker genes (x-axis) in the clusters annotated by |
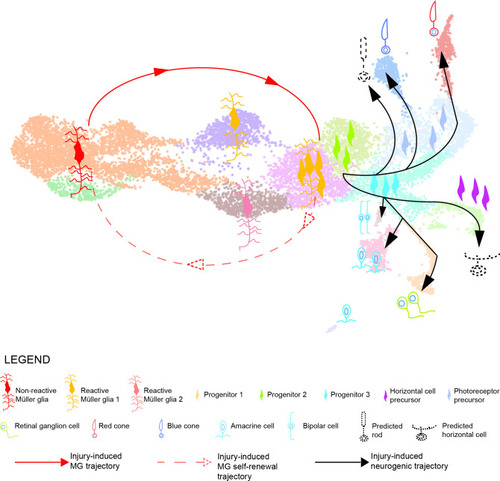
Model summarizing the cellular events underlying retina regeneration in zebrafish. Upon lesion, non-reactive MG on the left side of the main transcriptional UMAP feed into a hybrid Müller glia/progenitor population via reactive Müller glia (solid red line). Based from this hybrid cell population, we find a Müller glia trajectory reverting to the initial starting point indicating Müller glia self-renewal (dashed red line). Moreover, the hybrid cell population represents the tip of the neurogenic trajectory, resulting in the formation of neuronal precursors and differentiating neurons (solid black lines). Differentiating rods and horizontal cells, which have not been found in the scRNAseq, are indicated with dashed lines and positioned in the predicted location on the main UMAP. |