
Figure 1—figure supplement 1.
- ID
- ZDB-FIG-231124-11
- Publication
- Celotto et al., 2023 - Single-cell RNA sequencing unravels the transcriptional network underlying zebrafish retina regeneration
- Other Figures
-
- Figure 1—figure supplement 1.
- Figure 1—figure supplement 1.
- Figure 1—figure supplement 2.
- Figure 1—figure supplement 3.
- Figure 2—figure supplement 1.
- Figure 2—figure supplement 1.
- Figure 2—figure supplement 2.
- Figure 3—figure supplement 1.
- Figure 3—figure supplement 1.
- Figure 3—figure supplement 2.
- Figure 4.
- Figure 5.
- Figure 6.
- Figure 7.
- Figure 8—figure supplement 1.
- Figure 8—figure supplement 1.
- Figure 8—figure supplement 2.
- Figure 9—figure supplement 1.
- Figure 9—figure supplement 1.
- Figure 10.
- All Figure Page
- Back to All Figure Page
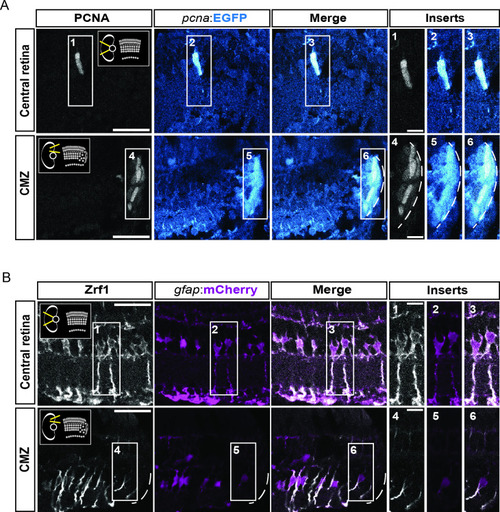
figure supplement 1.. characterization of the fluorescent reporter lines Tg(pcna:EGFP) and Tg(gfap:mCherry) in double transgenic animals. (A) Confocal images of immunohistochemistry against the proliferation marker PCNA (grey) and EGFP (blue) on retinal sections of Tg(pcna:EGFP);Tg(gfap:mCherry) animals. Schemes in the thumbnails on the top-right and top-left of the PCNA panels indicate the region of interest, either the central retina or the ciliary marginal zone (CMZ). N=3 fish. (B) Confocal images of immunohistochemistry detecting Zrf1-positive MG fibers (magenta) and mCherry on retinal sections of Tg(pcna:EGFP);Tg(gfap:mCherry) animals. N=3 fish. Scale bar: 30 µm for main panels, 10 µm for inserts. |