
FIGURE
Figure 8—figure supplement 1.
- ID
- ZDB-FIG-231124-24
- Publication
- Celotto et al., 2023 - Single-cell RNA sequencing unravels the transcriptional network underlying zebrafish retina regeneration
- Other Figures
-
- Figure 1—figure supplement 1.
- Figure 1—figure supplement 1.
- Figure 1—figure supplement 2.
- Figure 1—figure supplement 3.
- Figure 2—figure supplement 1.
- Figure 2—figure supplement 1.
- Figure 2—figure supplement 2.
- Figure 3—figure supplement 1.
- Figure 3—figure supplement 1.
- Figure 3—figure supplement 2.
- Figure 4.
- Figure 5.
- Figure 6.
- Figure 7.
- Figure 8—figure supplement 1.
- Figure 8—figure supplement 1.
- Figure 8—figure supplement 2.
- Figure 9—figure supplement 1.
- Figure 9—figure supplement 1.
- Figure 10.
- All Figure Page
- Back to All Figure Page
Figure 8—figure supplement 1.
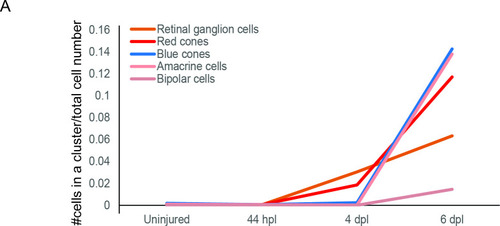
birthdate order of regenerated progeny. Graph plotting the fraction of cells (y-axis) embarking on a specific retinal cell fate (coloured curves) in relation to a given time point (x-axis). Total number of cells per condition: uninjured = 2243, 44 hpl = 1723, 4 dpl = 4899, 6 dpl = 2,825. |
Expression Data
Expression Detail
Antibody Labeling
Phenotype Data
Phenotype Detail
Acknowledgments
This image is the copyrighted work of the attributed author or publisher, and
ZFIN has permission only to display this image to its users.
Additional permissions should be obtained from the applicable author or publisher of the image.
Full text @ Elife