
Figure 8—figure supplement 1.
- ID
- ZDB-FIG-231124-23
- Publication
- Celotto et al., 2023 - Single-cell RNA sequencing unravels the transcriptional network underlying zebrafish retina regeneration
- Other Figures
-
- Figure 1—figure supplement 1.
- Figure 1—figure supplement 1.
- Figure 1—figure supplement 2.
- Figure 1—figure supplement 3.
- Figure 2—figure supplement 1.
- Figure 2—figure supplement 1.
- Figure 2—figure supplement 2.
- Figure 3—figure supplement 1.
- Figure 3—figure supplement 1.
- Figure 3—figure supplement 2.
- Figure 4.
- Figure 5.
- Figure 6.
- Figure 7.
- Figure 8—figure supplement 1.
- Figure 8—figure supplement 1.
- Figure 8—figure supplement 2.
- Figure 9—figure supplement 1.
- Figure 9—figure supplement 1.
- Figure 10.
- All Figure Page
- Back to All Figure Page
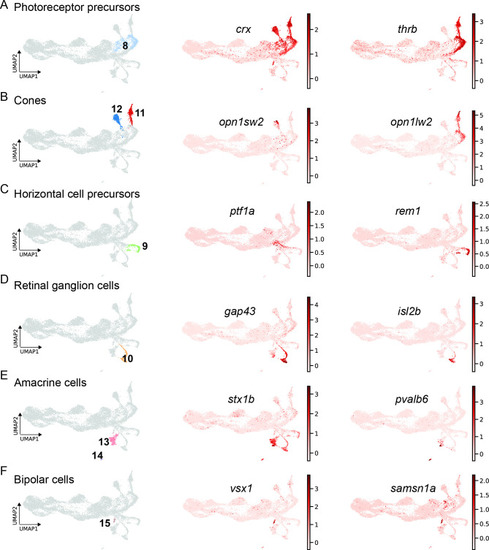
scRNAseq identifies fate-restricted progenitors and differentiating progeny in the light-lesioned retina. (A) The photoreceptor precursor cluster (cluster 8) and the expression levels of crx and thrb. (B) The red and blue cone cluster (clusters 11 and 12) and the expression levels of the blue cone marker opn1sw2 and red cone marker opn1lw2. (C) The horizontal cell precursor cluster (cluster 9) and the expression levels of ptf1a and rem1. (D) The ganglion cell cluster (cluster 10) and the expression levels of gap43 and isl2b. (E) The two amacrine cell clusters (clusters 14 and 15) and the expression levels of stx1b and pvalb6. (D) The bipolar cell cluster (cluster 15) and the expression levels of the known bipolar cell marker vsx1 and the novel marker samsn1a. Associated: Figure 8—figure supplements 1 and 2. |