
Figure 1—figure supplement 1.
- ID
- ZDB-FIG-231124-10
- Publication
- Celotto et al., 2023 - Single-cell RNA sequencing unravels the transcriptional network underlying zebrafish retina regeneration
- Other Figures
-
- Figure 1—figure supplement 1.
- Figure 1—figure supplement 1.
- Figure 1—figure supplement 2.
- Figure 1—figure supplement 3.
- Figure 2—figure supplement 1.
- Figure 2—figure supplement 1.
- Figure 2—figure supplement 2.
- Figure 3—figure supplement 1.
- Figure 3—figure supplement 1.
- Figure 3—figure supplement 2.
- Figure 4.
- Figure 5.
- Figure 6.
- Figure 7.
- Figure 8—figure supplement 1.
- Figure 8—figure supplement 1.
- Figure 8—figure supplement 2.
- Figure 9—figure supplement 1.
- Figure 9—figure supplement 1.
- Figure 10.
- All Figure Page
- Back to All Figure Page
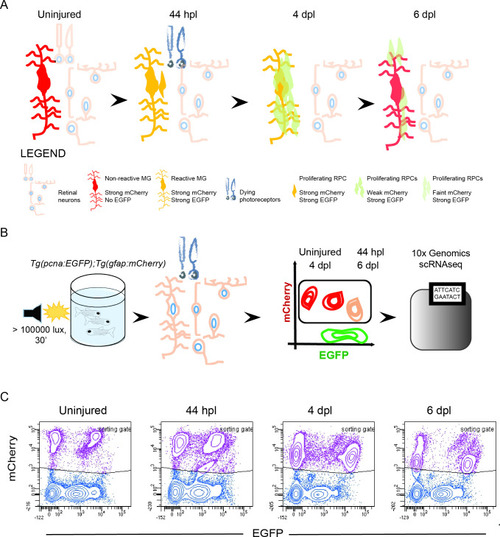
Isolation of individual MG, RPCs and regenerated progeny using fluorescent reporters. (A) Schematic illustration of the rationale to isolate individual cells from regenerating retinae of double transgenic Tg(pcna:EGFP);Tg(gfap:mCherry) animals. In the uninjured retina, MG express strong levels of mCherry but no EGFP. Upon light lesion, which results in dying photoreceptors, MG turn on EGFP resulting in the presence of both fluorophores at 44 hours post lesion (hpl). At 4 days post lesion (dpl), MG remain to contain strong mCherry and EGFP levels. In contrast, further proliferating RPCs display weak mCherry but strong EGFP fluorescence. Finally, MG have lost the EGFP signal at 6 dpl, expressing mCherry only. RPCs, which start to migrate and differentiate, are still detectable but show diluted levels of mCherry and EGFP. (B) Schematic illustration of the workflow for the scRNAseq experiment. Uninjured control and light lesioned retinae (44 hpl, 4 dpl, 6 dpl) of double transgenic Tg(pcna:EGFP);Tg(gfap:mCherry) animals were dissociated to obtain a single cell suspension. Following fluorescent activated cell sorting of mCherry-positive only and EGFP/mCherry-double positive cells, individual cells were eventually subjected to droplet-based, 10 x Genomics scRNAseq. (C) Flow cytometry plots depicting EGFP and mCherry fluorescence of dissociated retinal cells at the indicated time points. Cells in the sorting gate include mCherry-positive only as well as mCherry/EGFP-double positive cells. Number of cells sorted from the sorting gate per time point: 15,000. Associated: Figure 1—figure supplements 1–3. |