
Figure 3—figure supplement 1.
- ID
- ZDB-FIG-231124-16
- Publication
- Celotto et al., 2023 - Single-cell RNA sequencing unravels the transcriptional network underlying zebrafish retina regeneration
- Other Figures
-
- Figure 1—figure supplement 1.
- Figure 1—figure supplement 1.
- Figure 1—figure supplement 2.
- Figure 1—figure supplement 3.
- Figure 2—figure supplement 1.
- Figure 2—figure supplement 1.
- Figure 2—figure supplement 2.
- Figure 3—figure supplement 1.
- Figure 3—figure supplement 1.
- Figure 3—figure supplement 2.
- Figure 4.
- Figure 5.
- Figure 6.
- Figure 7.
- Figure 8—figure supplement 1.
- Figure 8—figure supplement 1.
- Figure 8—figure supplement 2.
- Figure 9—figure supplement 1.
- Figure 9—figure supplement 1.
- Figure 10.
- All Figure Page
- Back to All Figure Page
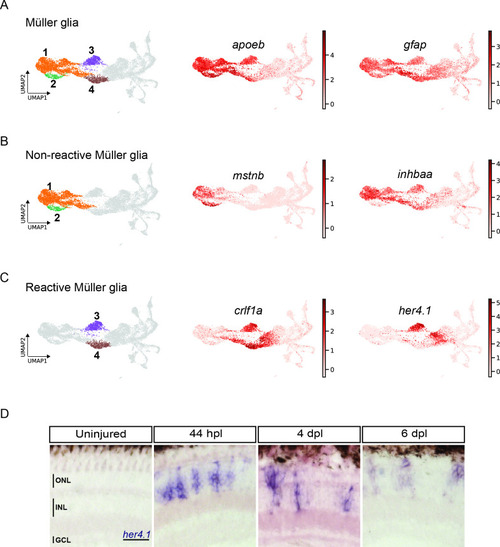
scRNAseq reveals heterogeneity in Müller glia and identifies two populations of non-reactive and two of reactive Müller glia in the light-lesioned retina. (A) Four Müller glia clusters (cluster 1–4) and the expression levels of apoeb and gfap. (B) The two non-reactive Müller glia clusters (cluster 1 and 2) and the expression levels of mstnb and inhbaa. Cells of both clusters express mstnb, but only cells in cluster 1 expresses inhbaa. (C) Visualization of the two reactive Müller glia clusters (cluster 3 and 4) and the relative expression levels of crlf1a and her4.1 projected onto the main transcriptional UMAP. Cells of both clusters express crlf1a, but only cells in cluster 3 expresses her4.1. (D) Bright field microscopy images of chromogenic in situ hybridization detecting her4.1 on retinal sections of uninjured control animals and at 44 hr post lesion (hpl), 4 days post lesion (dpl) and 6 dpl. N=3 fish per time point and uninjured controls. The position of the outer nuclear layer (ONL), inner nuclear layer (INL) and ganglion cell layer (GCL) is indicated in the uninjured sample. Scale bar: 30 µm. Associated: Figure 3—figure supplements 1 and 2. |