
Figure 2—figure supplement 1.
- ID
- ZDB-FIG-231124-14
- Publication
- Celotto et al., 2023 - Single-cell RNA sequencing unravels the transcriptional network underlying zebrafish retina regeneration
- Other Figures
-
- Figure 1—figure supplement 1.
- Figure 1—figure supplement 1.
- Figure 1—figure supplement 2.
- Figure 1—figure supplement 3.
- Figure 2—figure supplement 1.
- Figure 2—figure supplement 1.
- Figure 2—figure supplement 2.
- Figure 3—figure supplement 1.
- Figure 3—figure supplement 1.
- Figure 3—figure supplement 2.
- Figure 4.
- Figure 5.
- Figure 6.
- Figure 7.
- Figure 8—figure supplement 1.
- Figure 8—figure supplement 1.
- Figure 8—figure supplement 2.
- Figure 9—figure supplement 1.
- Figure 9—figure supplement 1.
- Figure 10.
- All Figure Page
- Back to All Figure Page
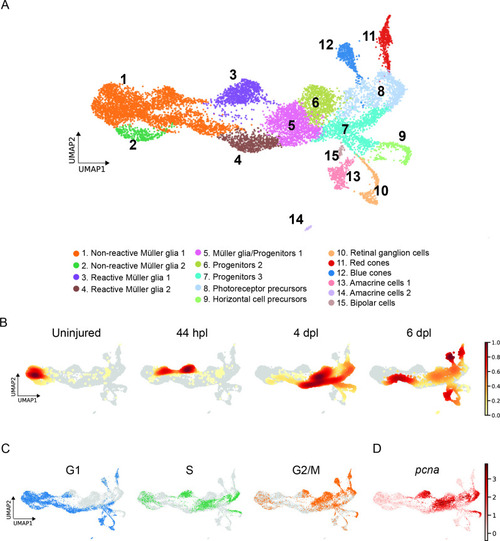
scRNAseq identifies 15 different cell populations in the light-lesioned retina. (A) A total of 11,690 cells depicted on the uniform manifold approximation and projection (UMAP) map. From left to right, the map shows a progressive emergence of MG, RPCs and progeny clusters. See figure legend for the detailed information about cluster identity. (B) Normalized cell density on the UMAP for the four different samples (uninjured, 44 hpl, 4 and 6 dpl). Dark red shows strong cell enrichment and no color absence of cells. (C) Cells colored by cell cycle phases (G1, S, and G2/M phase in blue, green and orange, respectively). (D) Expression of pcna. Legend: logarithm of normalized counts per million. Associated: Figure 2—figure supplements 1 and 2. |